Operator
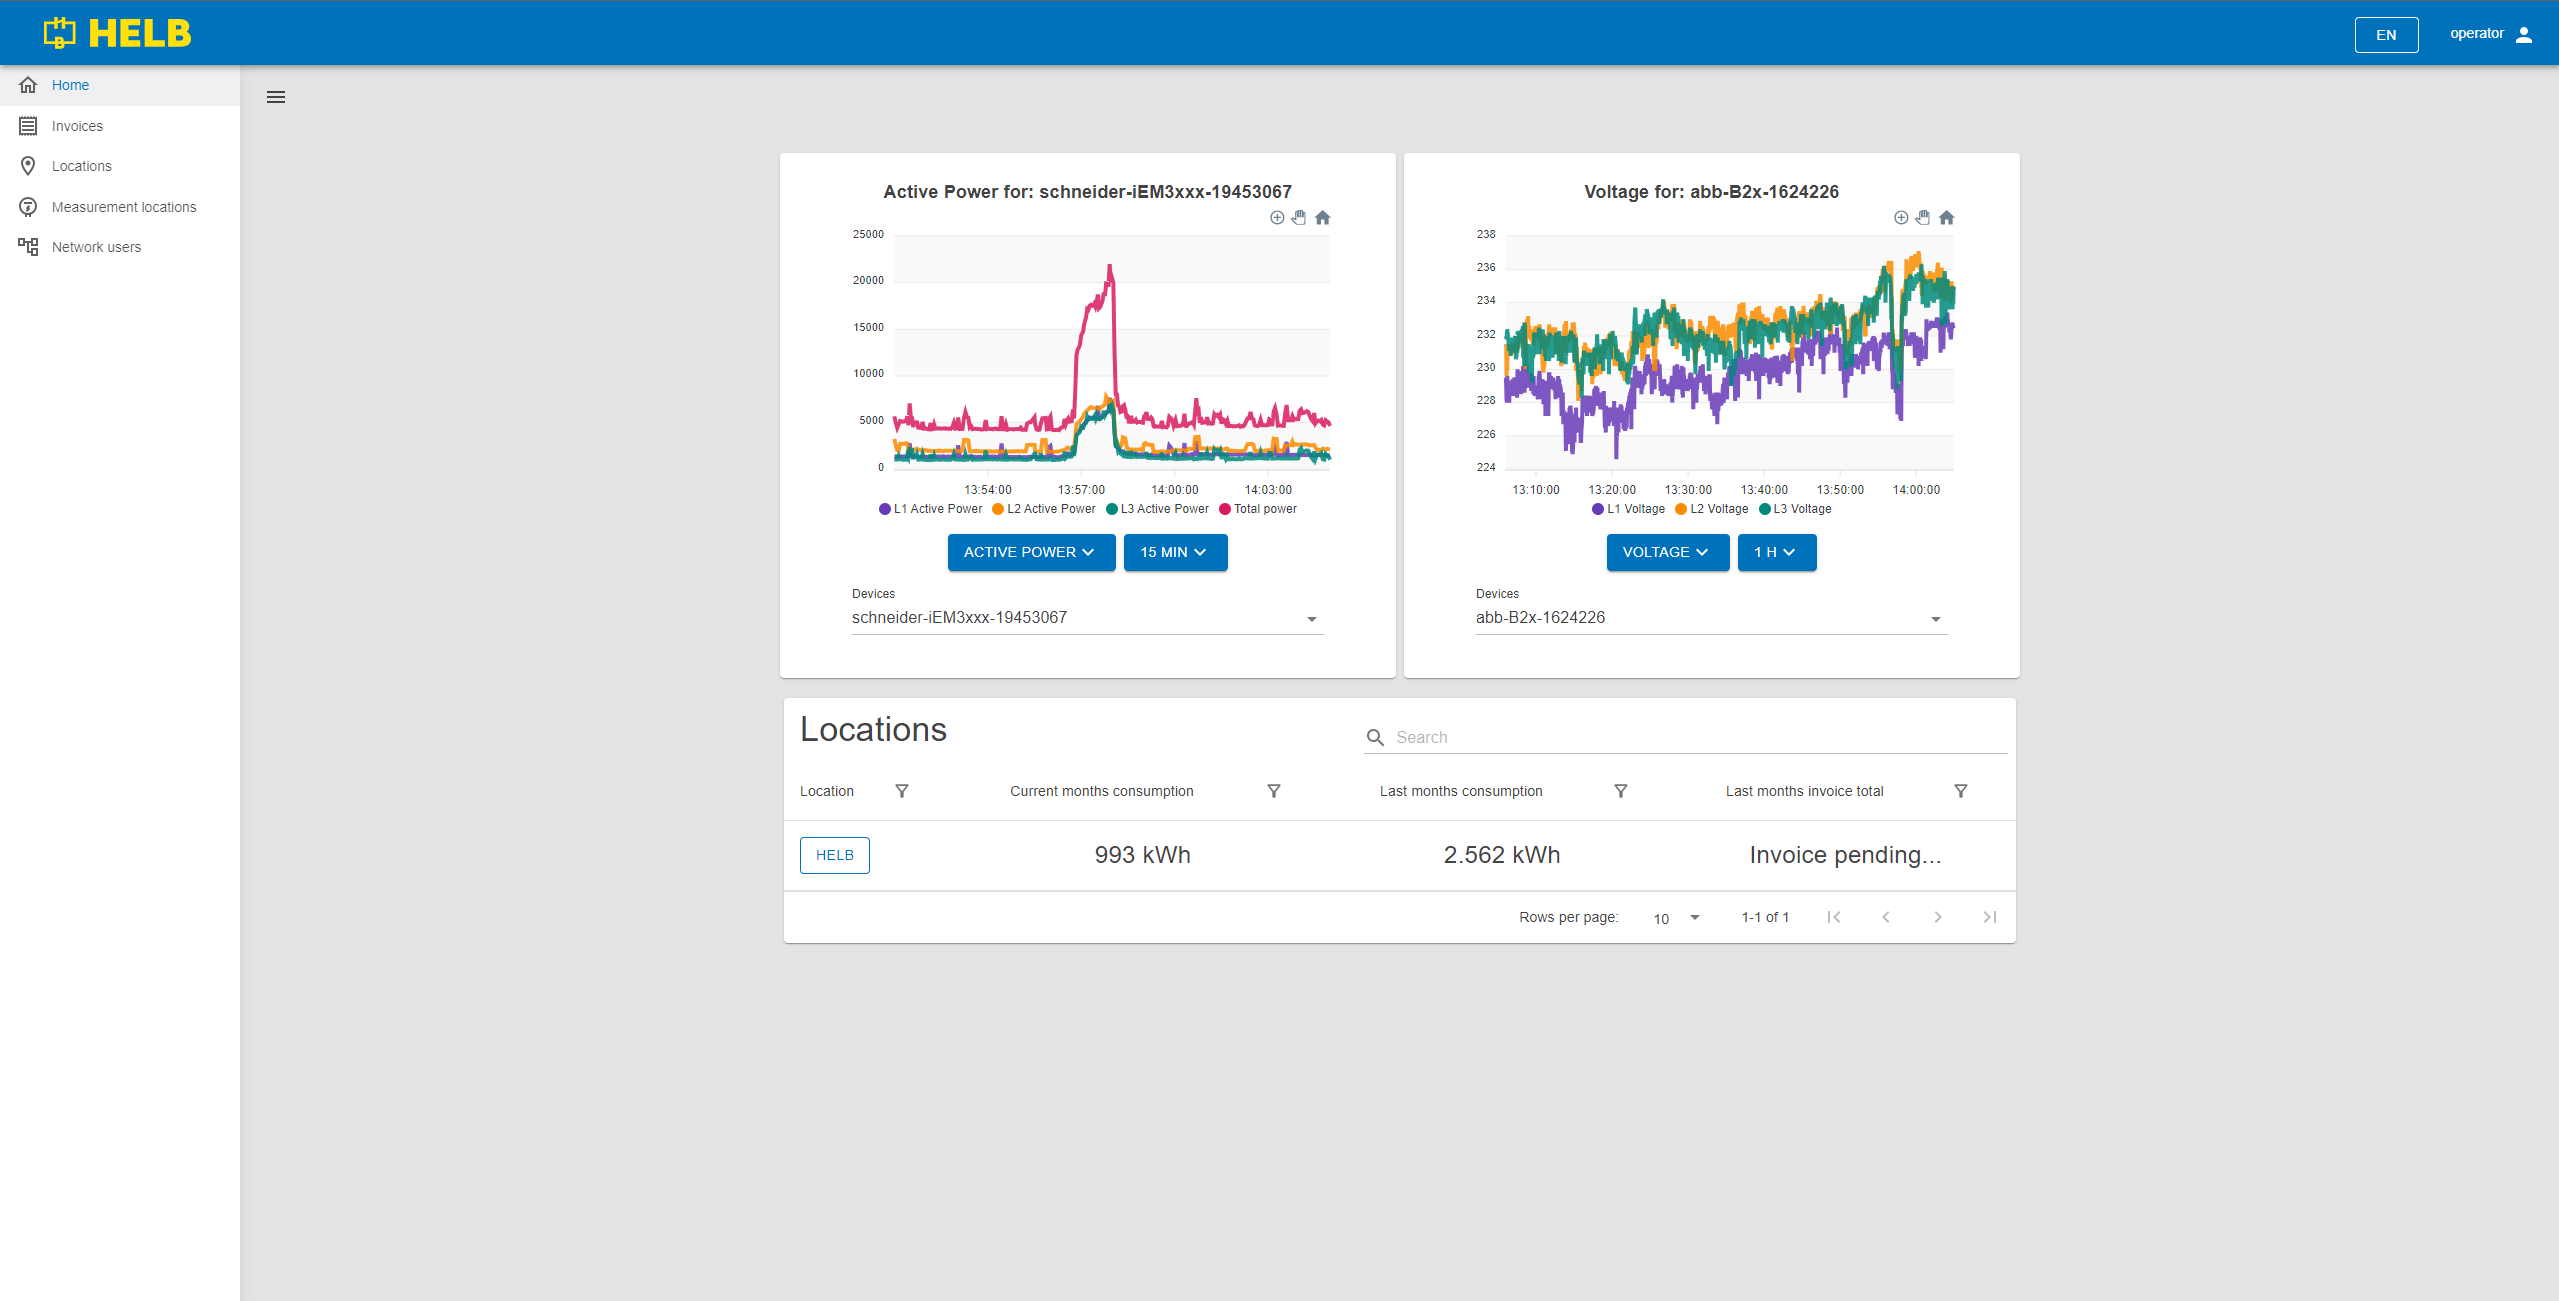
The dashboard for a user selected to oversee all aspects of the network.
Content
 /app
/app
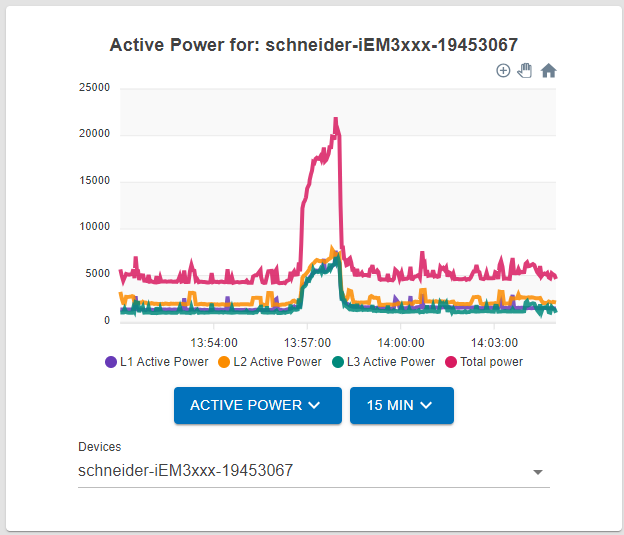
Operator Graph
This graph displays various data for any device in the network. By changing the settings on each graph, users can get an accurate overview of the function of any device in the network.
There are two dropdown menus and an auto-completing text box.
The left dropdown allows the user to select the type of data they want to see.
The right dropdown allows the user to change the time scale of the data visualization in steps of 15 minutes, 1 hour, 6 hours, and 24 hours.
The auto-completing text box labeled "Devices" allows the user to select which device's data will be displayed.
 Operator
Graph
Operator
Graph
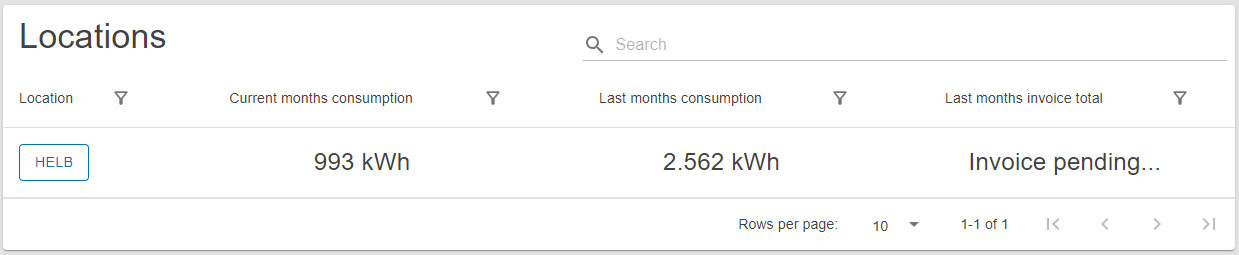
Location Table
This table shows all locations the current user can oversee.
The user can see the name of each location, its current month's consumption, last month's consumption, and last month's invoice total.
By clicking on the name of the location, the user can inspect that location's data.
 Location Table