Wiki
This is the wiki for the OZDS project.
Development
Here are some answers to questions developers might have when developing OZDS.
How do I prepare OZDS for development?
Install just,
docker,
node, dvc,
dotnet,
nushell and
powershell.
Prepare dvc by asking a fellow developer for the configuration and following
their instructions. Finally, run just prepare from the command line.
How do I start developing OZDS?
After preparing OZDS for development,
open OZDS in your editor of choice (we recommend
Visual Studio Code) and run just dev on the
command line. We also recommend seeding the database with measurements
continuously by running just fake on another command line. After the server
starts, navigate to localhost in your browser of
choice. Hot reload is enabled by default so there is no need of rerunning any
commands on changes.
How do I debug OZDS?
Start developing OZDS except running
just dev on the command line and instead run the appropriate configuration in
your editor of choice. For Visual Studio Code, this will be the debug
configuration and for Visual Studio this will be the Ozds.Server startup
project.
I have changed the database scheme of OZDS - how do I create a migration?
Run just migrate {{name-of-migration}} from the command line.
How do I run tests on OZDS?
Most likely, your editor of choice will discover tests and you can run them from
there, but if you prefer, you can run just test on the command line. Please
refer to the
dotnet test documentation
for more details on the various options you can pass. The most common use case
is to limit the tests ran to a specific name and you can do that with
just test --filter "FullyQualifiedName~{{your-test-name}}".
Something has gone wrong with my development OZDS database - how do I reset it?
Run just clean from the command line.
I am getting cryptic errors - what is the panic button?
Run just purge from the command line.
Users
This portion of the documentation is meant for the end users of the OZDS web application. This documentation outlines all functionality and features of the OZDS web application divided for certain roles of users.
The admin portion describes all functionality and features for administrators of the application. These are not considered end users and are usually developers.
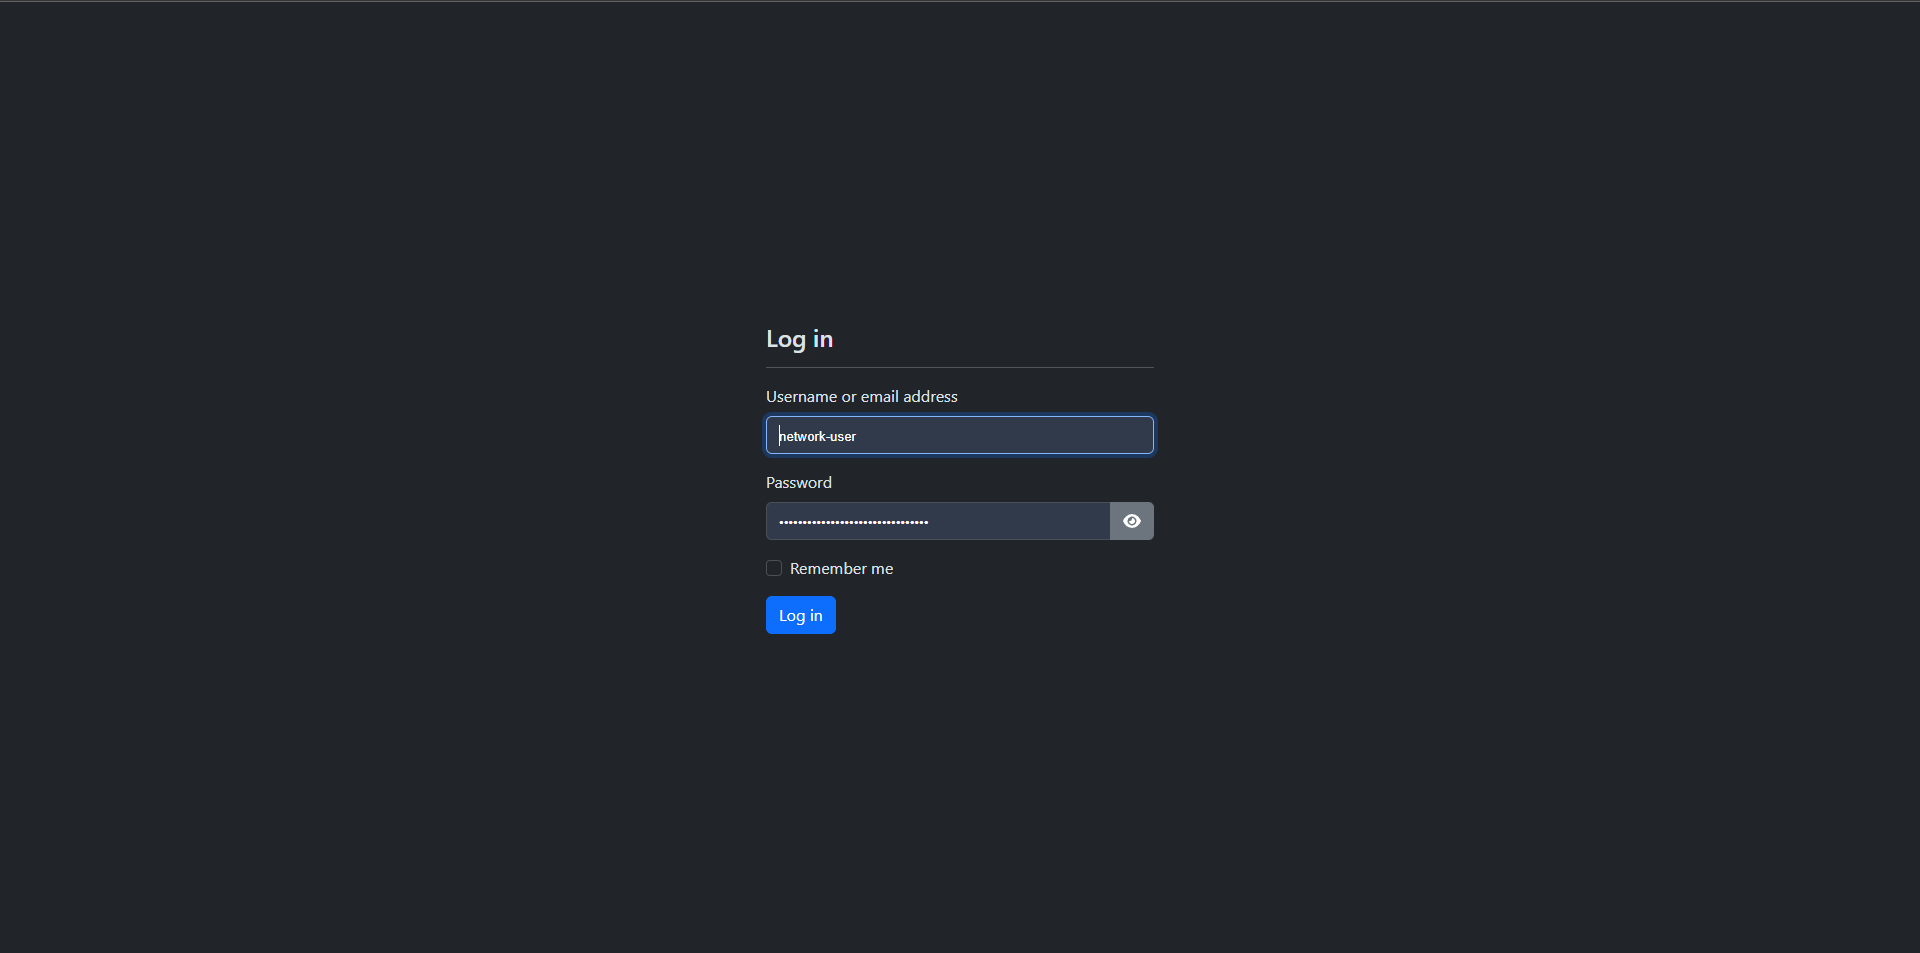
Login
On the login page, users start their session. After logging in, the user is redirected to a page personalized to their needs based on their user type, privileges, and the locations and network users they are responsible for.
 /login
Admin
The administrator can change some app settings and modify users.
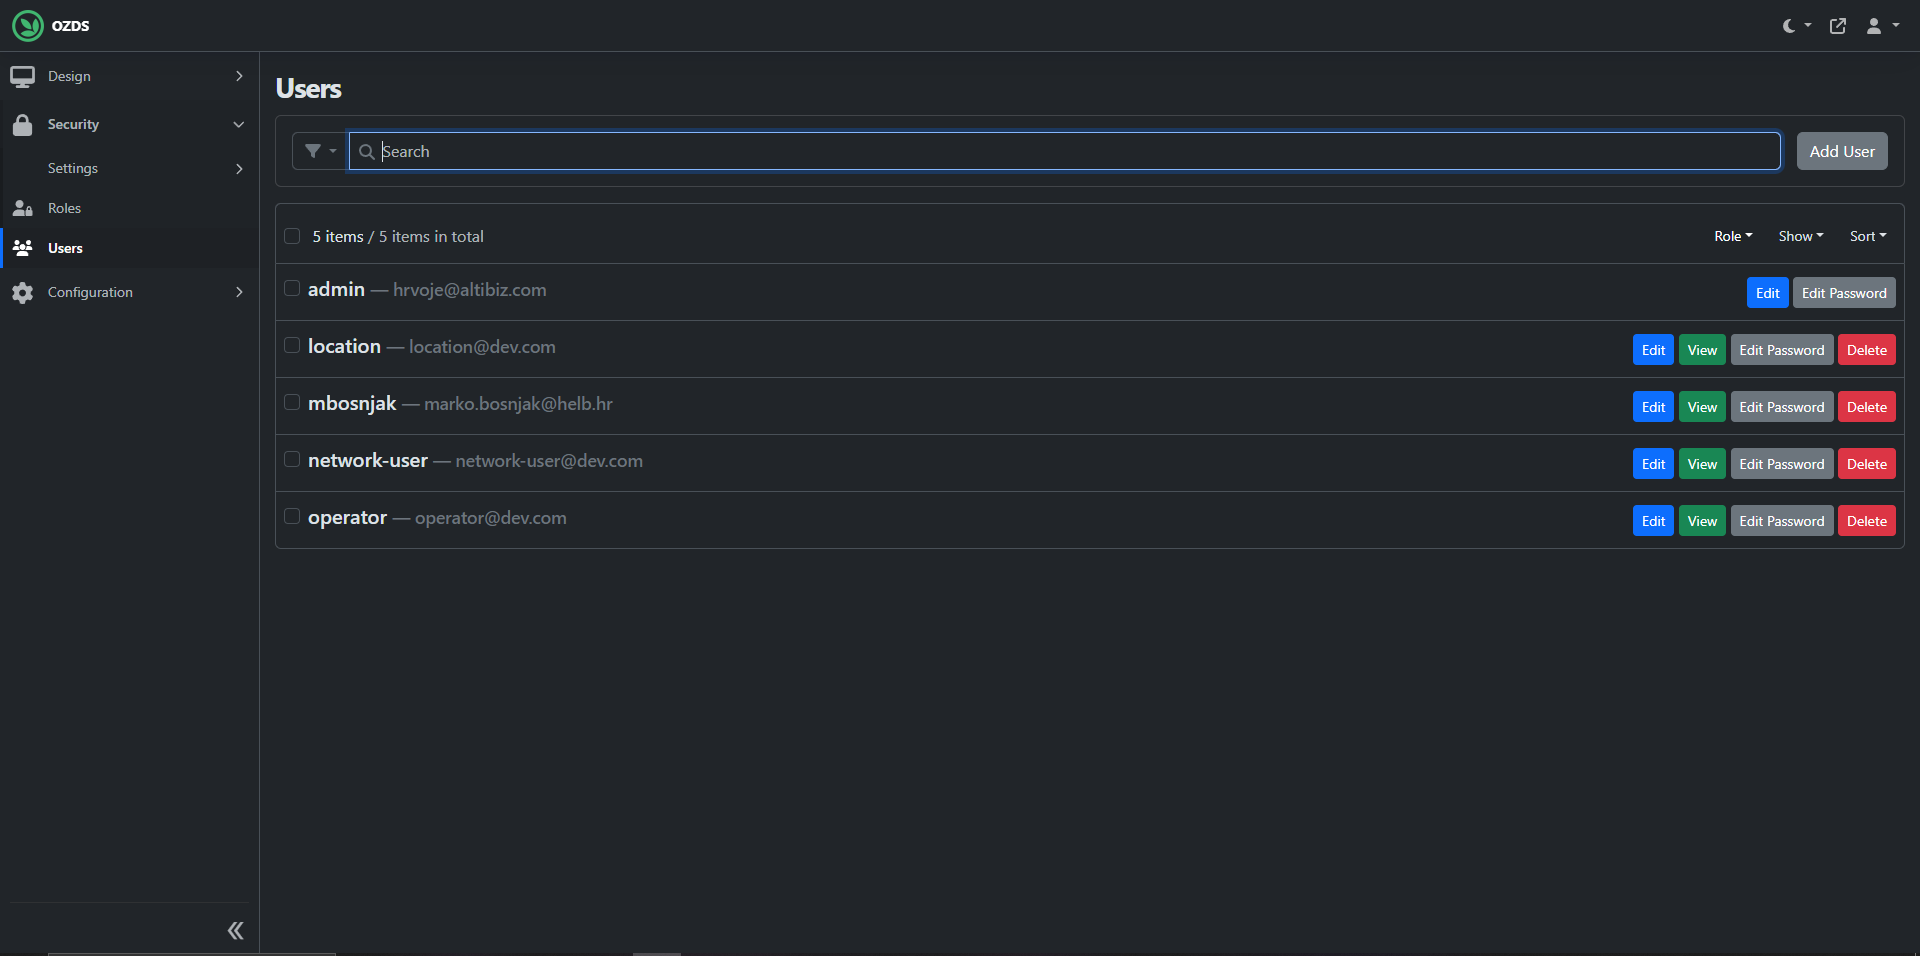
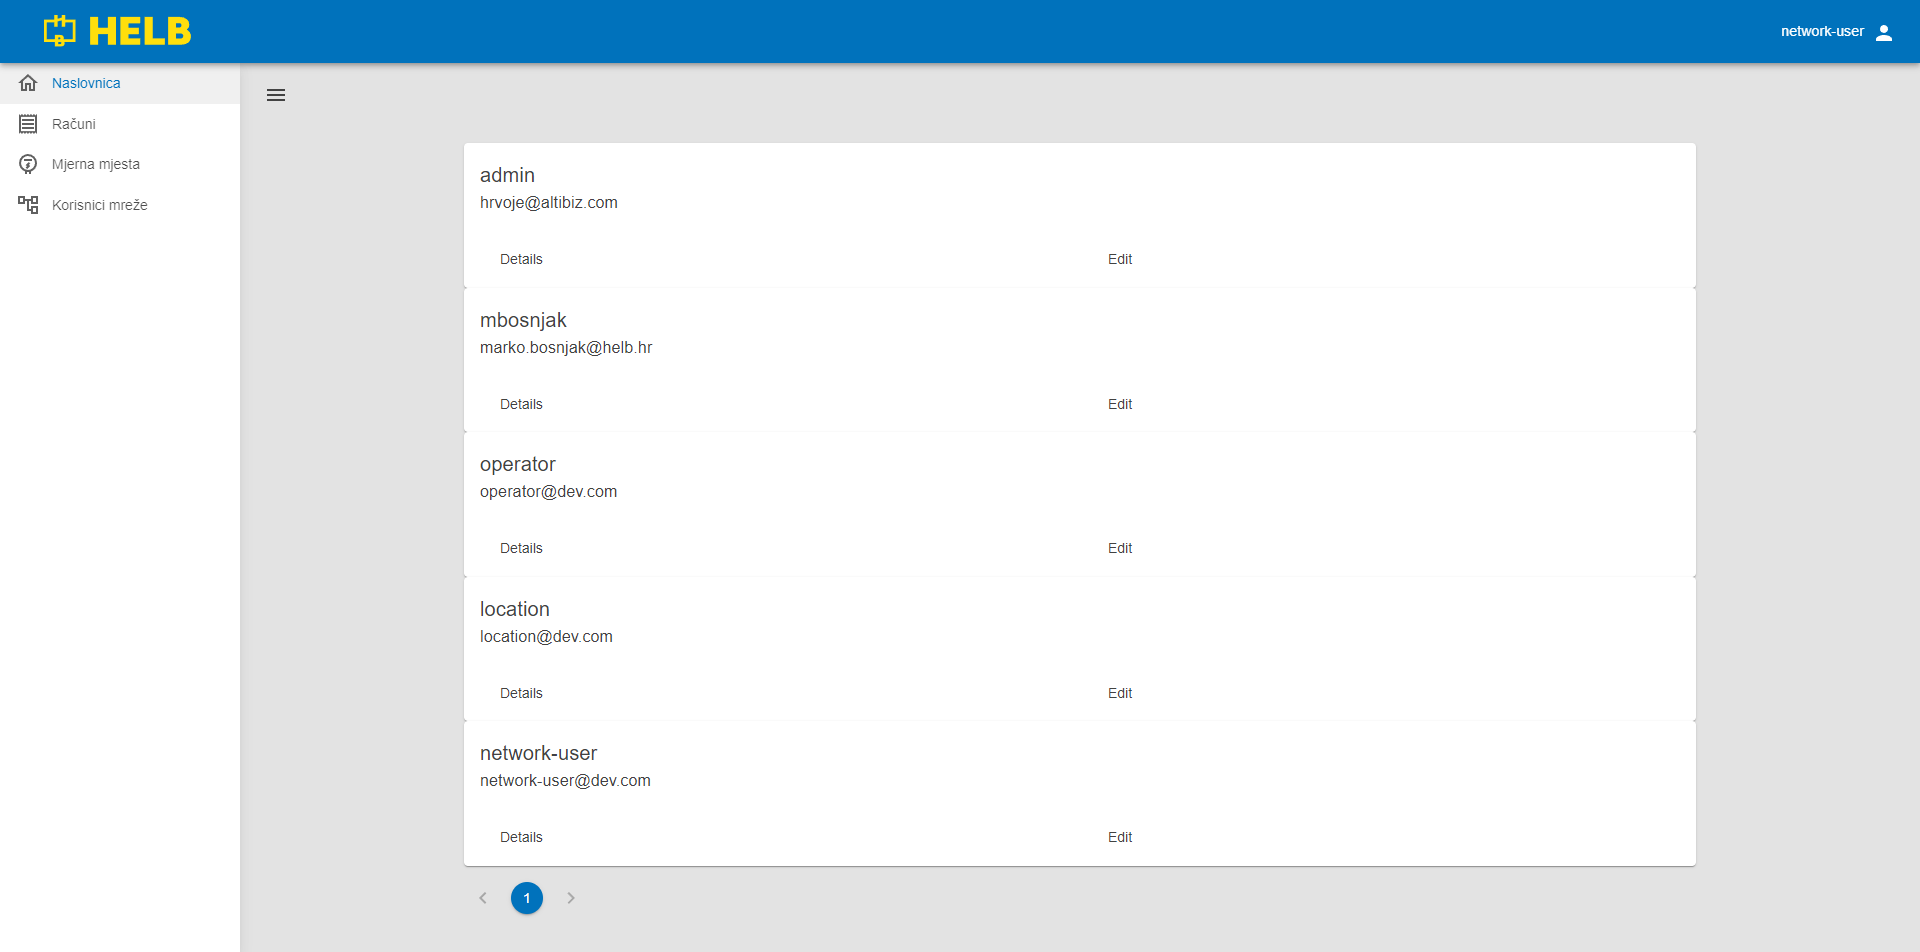
Users
On this interface, all aspects of users can be modified, new users can be created, or existing ones can be deleted. These users are later linked to representatives of network users and locations.
 /admin/users
Location
The dashboard for a user selected to oversee locations.
Content
 /app
/app
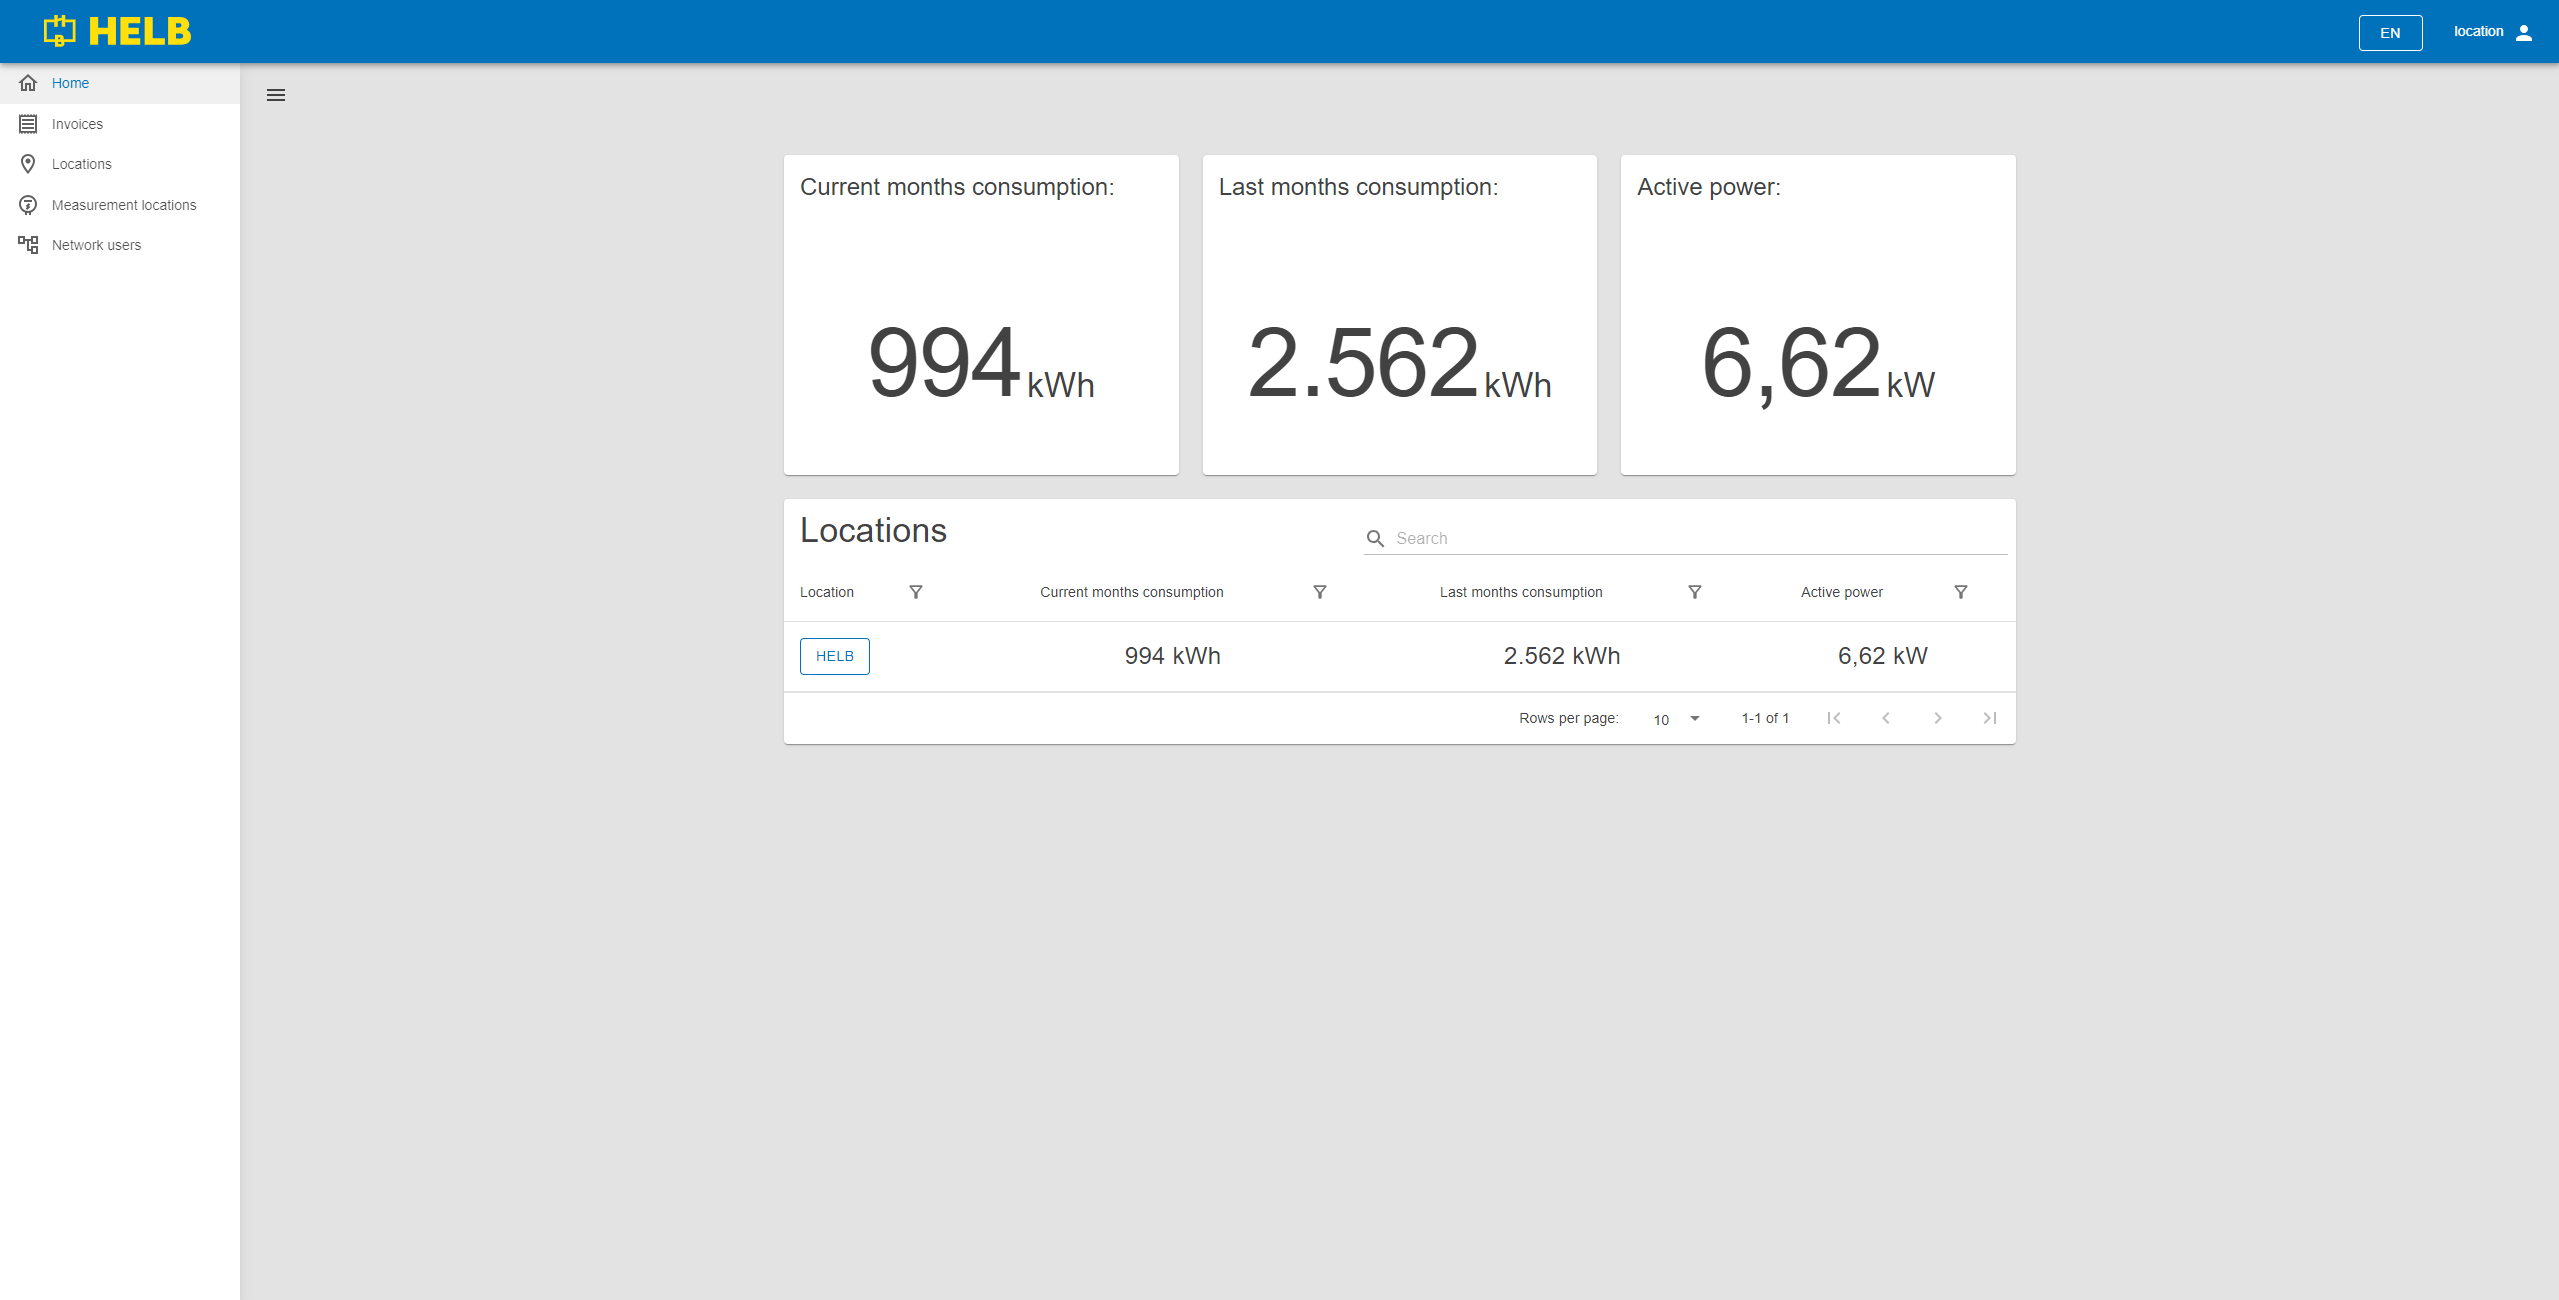
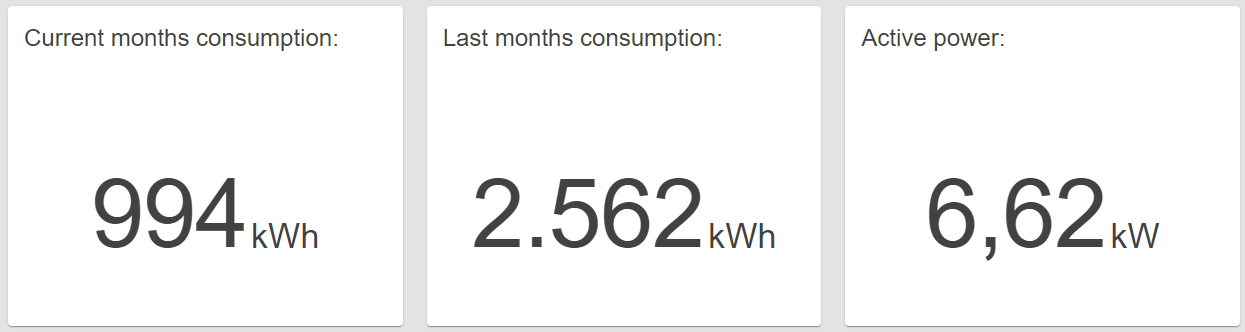
Location Home Panel
This panel displays three segments showing the combined values of current month's consumption, last month's consumption, and current power consumption.
 Location Home Panel Component
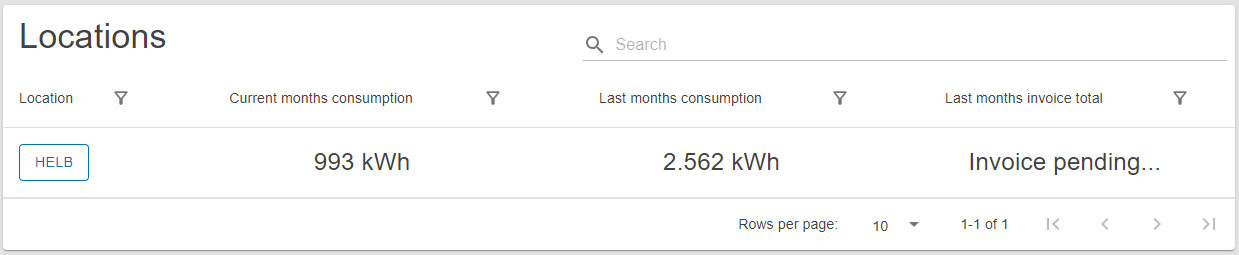
Location Table
This table shows all locations the current user can oversee.
The user can see the name of each location, its current month's consumption, last month's consumption, and current power consumption for each location.
By clicking on the name of the location, the user can inspect that location's data.
 Location Table
Network user
The dashboard for a user selected to oversee network users.
Content
 /app
/app
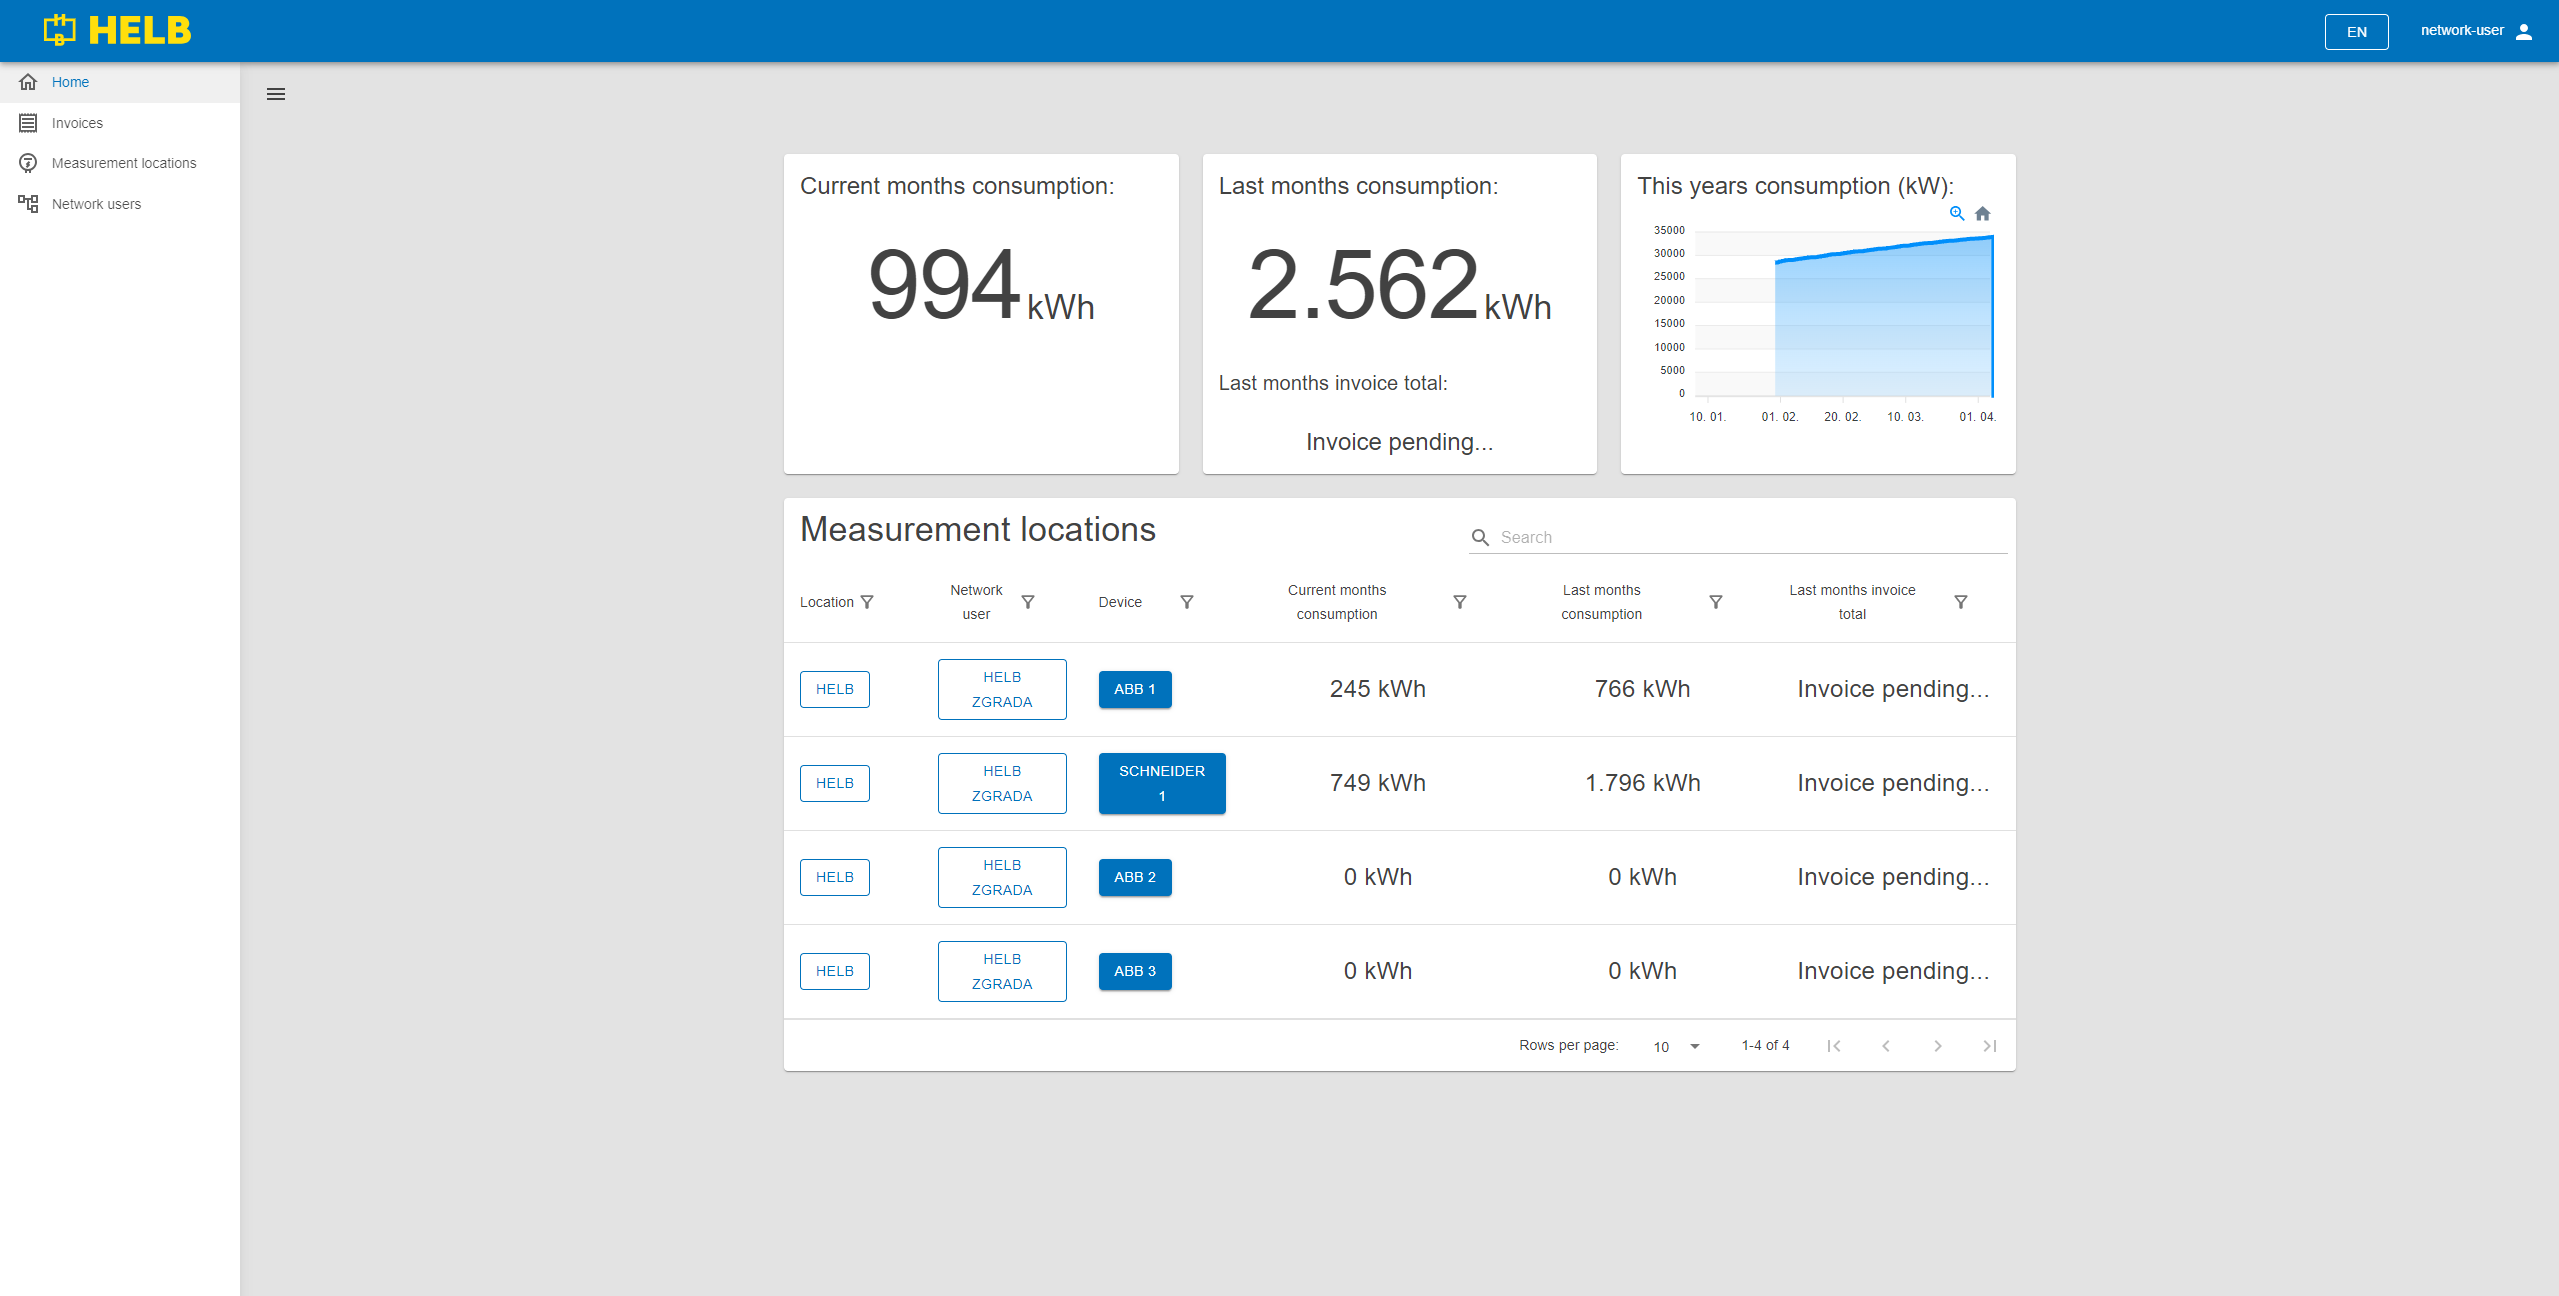
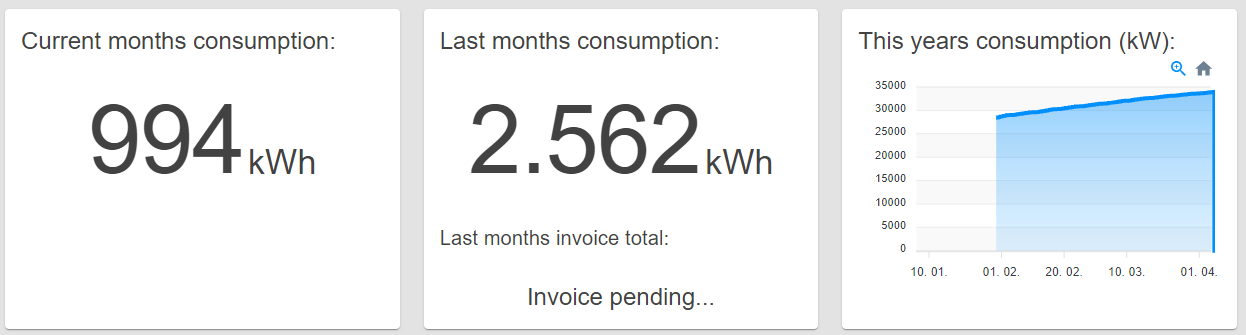
Network user Home Panel
This panel displays three segments showing the combined values of current month's consumption, last month's consumption, and last month's total invoices.
There is also a graph showing this year's power consumption.
 Network User Home Panel
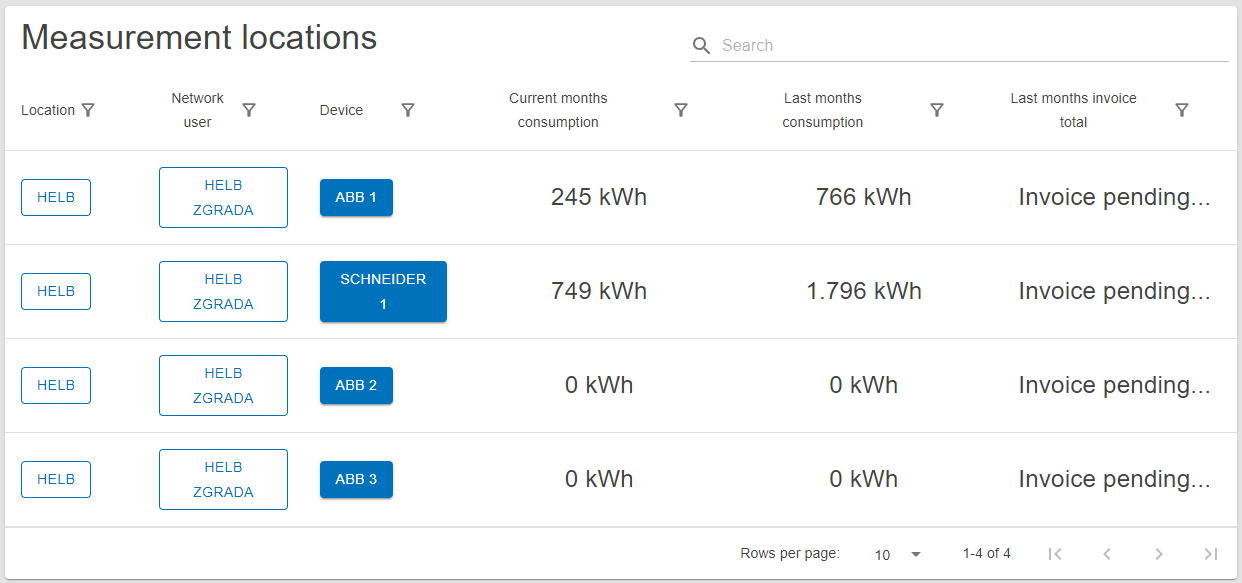
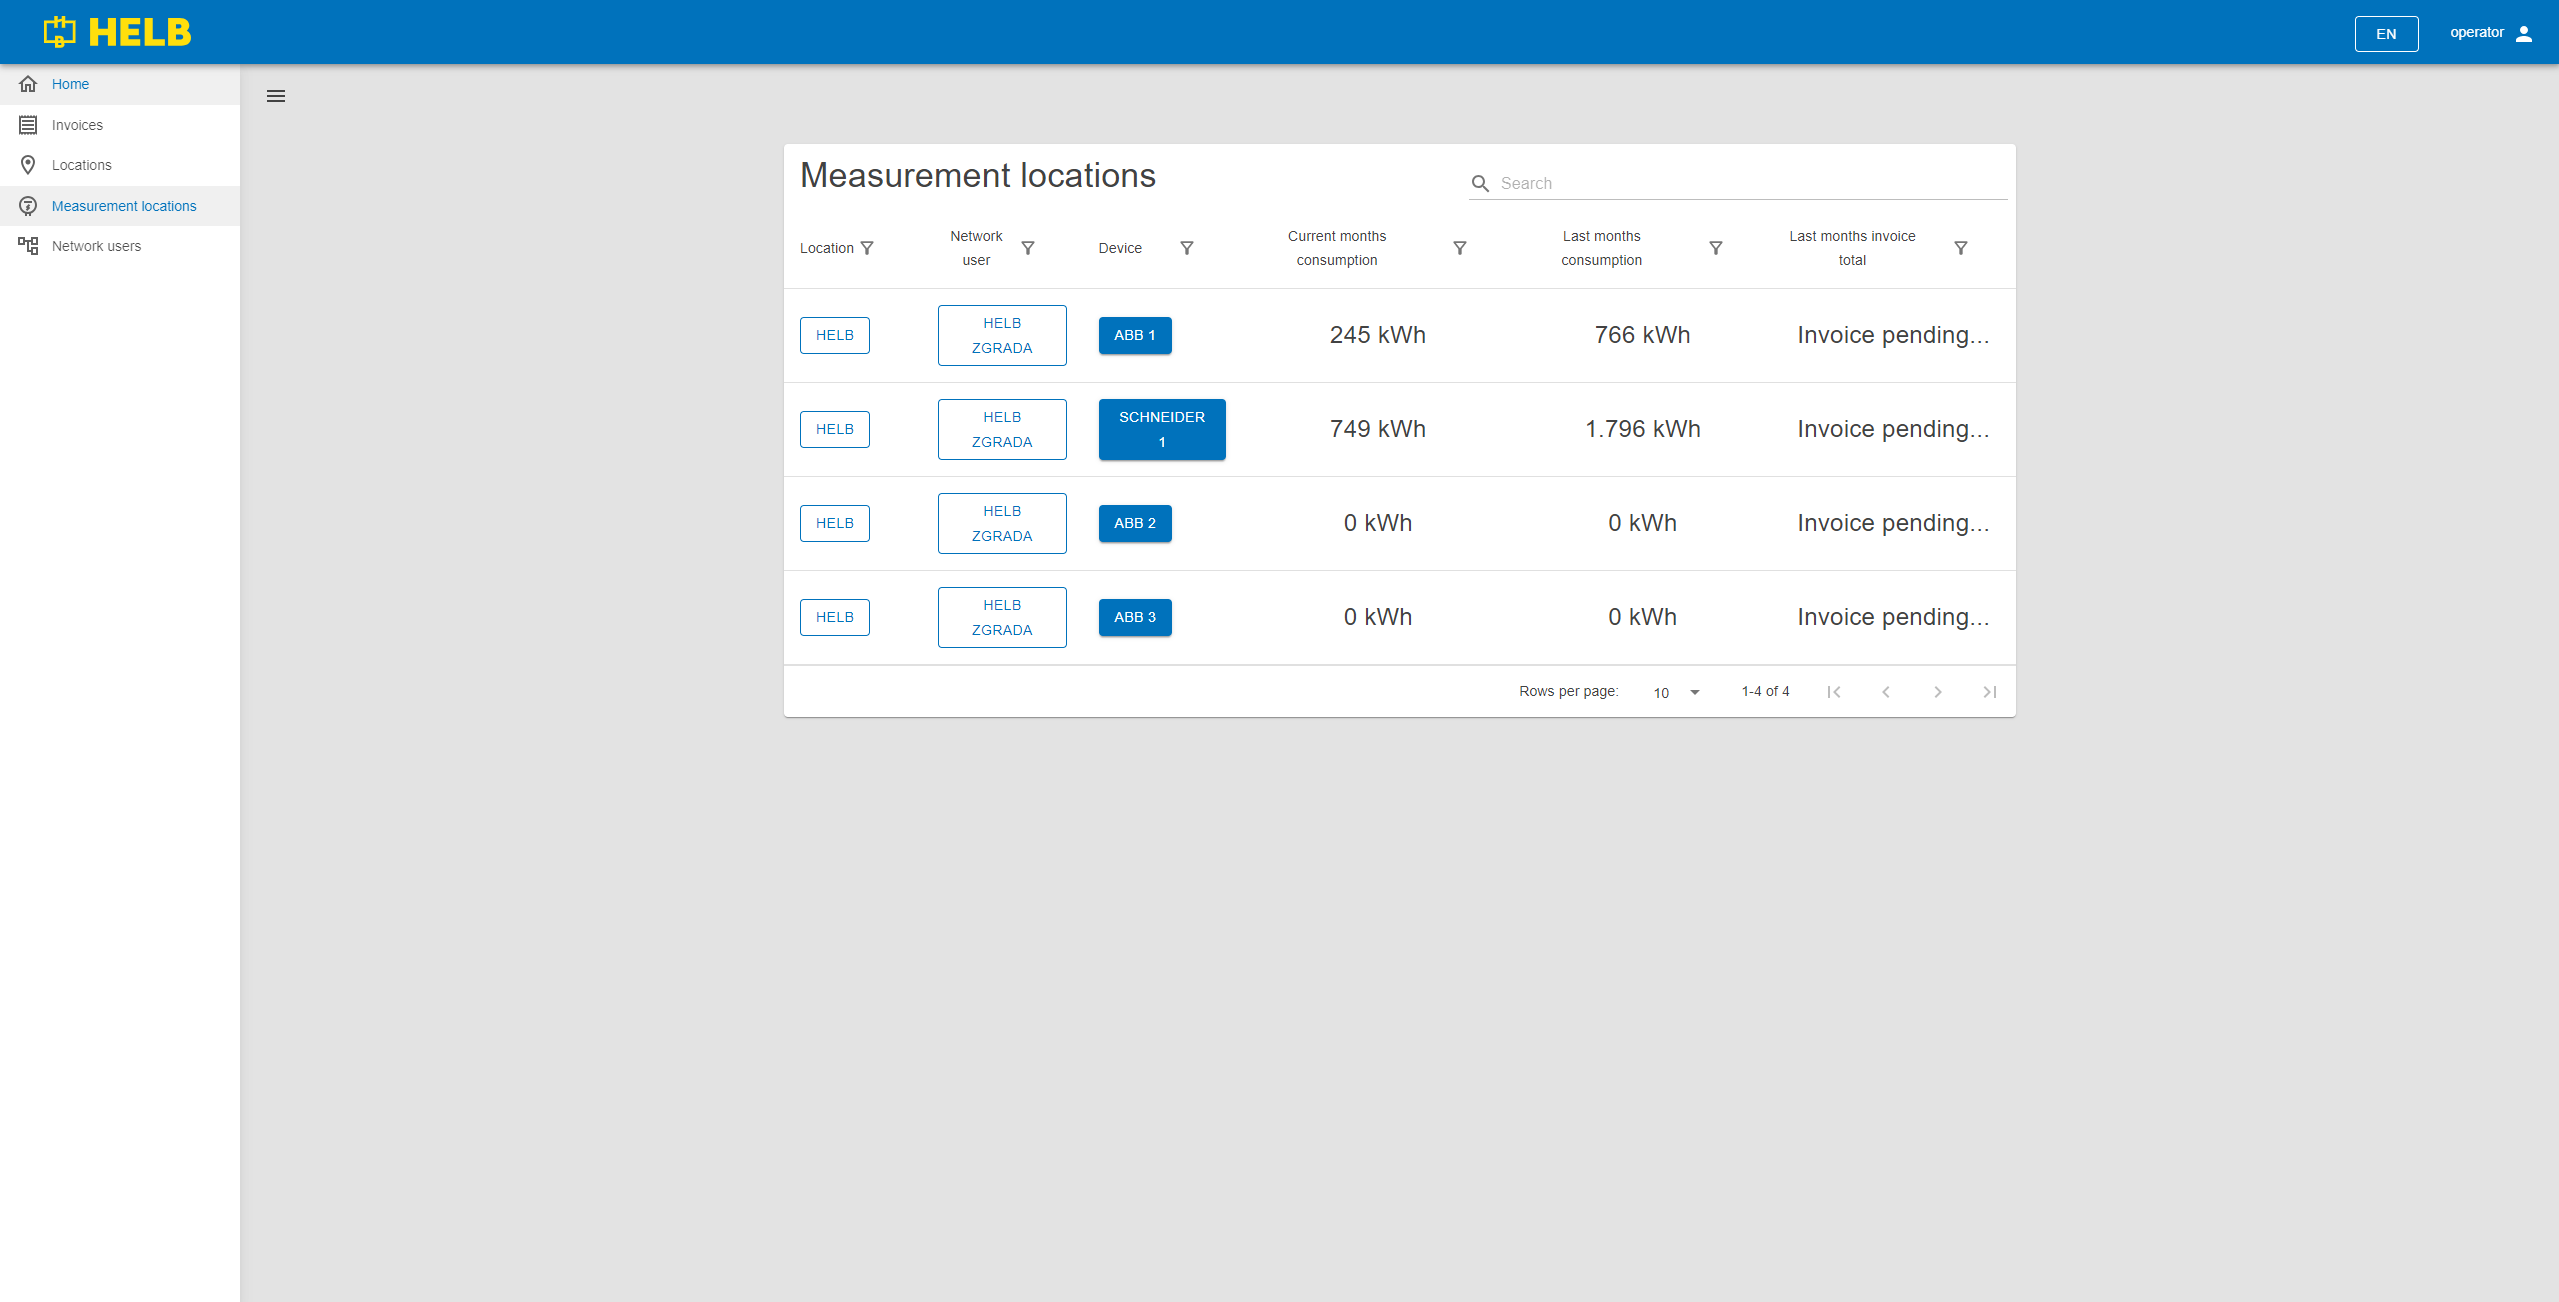
Measurement Location Table
This table shows all measurement locations the current user can oversee.
The user can see the name of the location, network user, and device at each measurement location. The table also displays the current month's consumption, last month's consumption, and last month's invoice total for those measurement locations.
By clicking on the name of the location or network user, the user can inspect the details of that entity.
Clicking on a device redirects to a detailed overview of individual measurement locations.
 Measurement Locations Table
Operator
The dashboard for a user selected to oversee all aspects of the network.
Content
 /app
/app
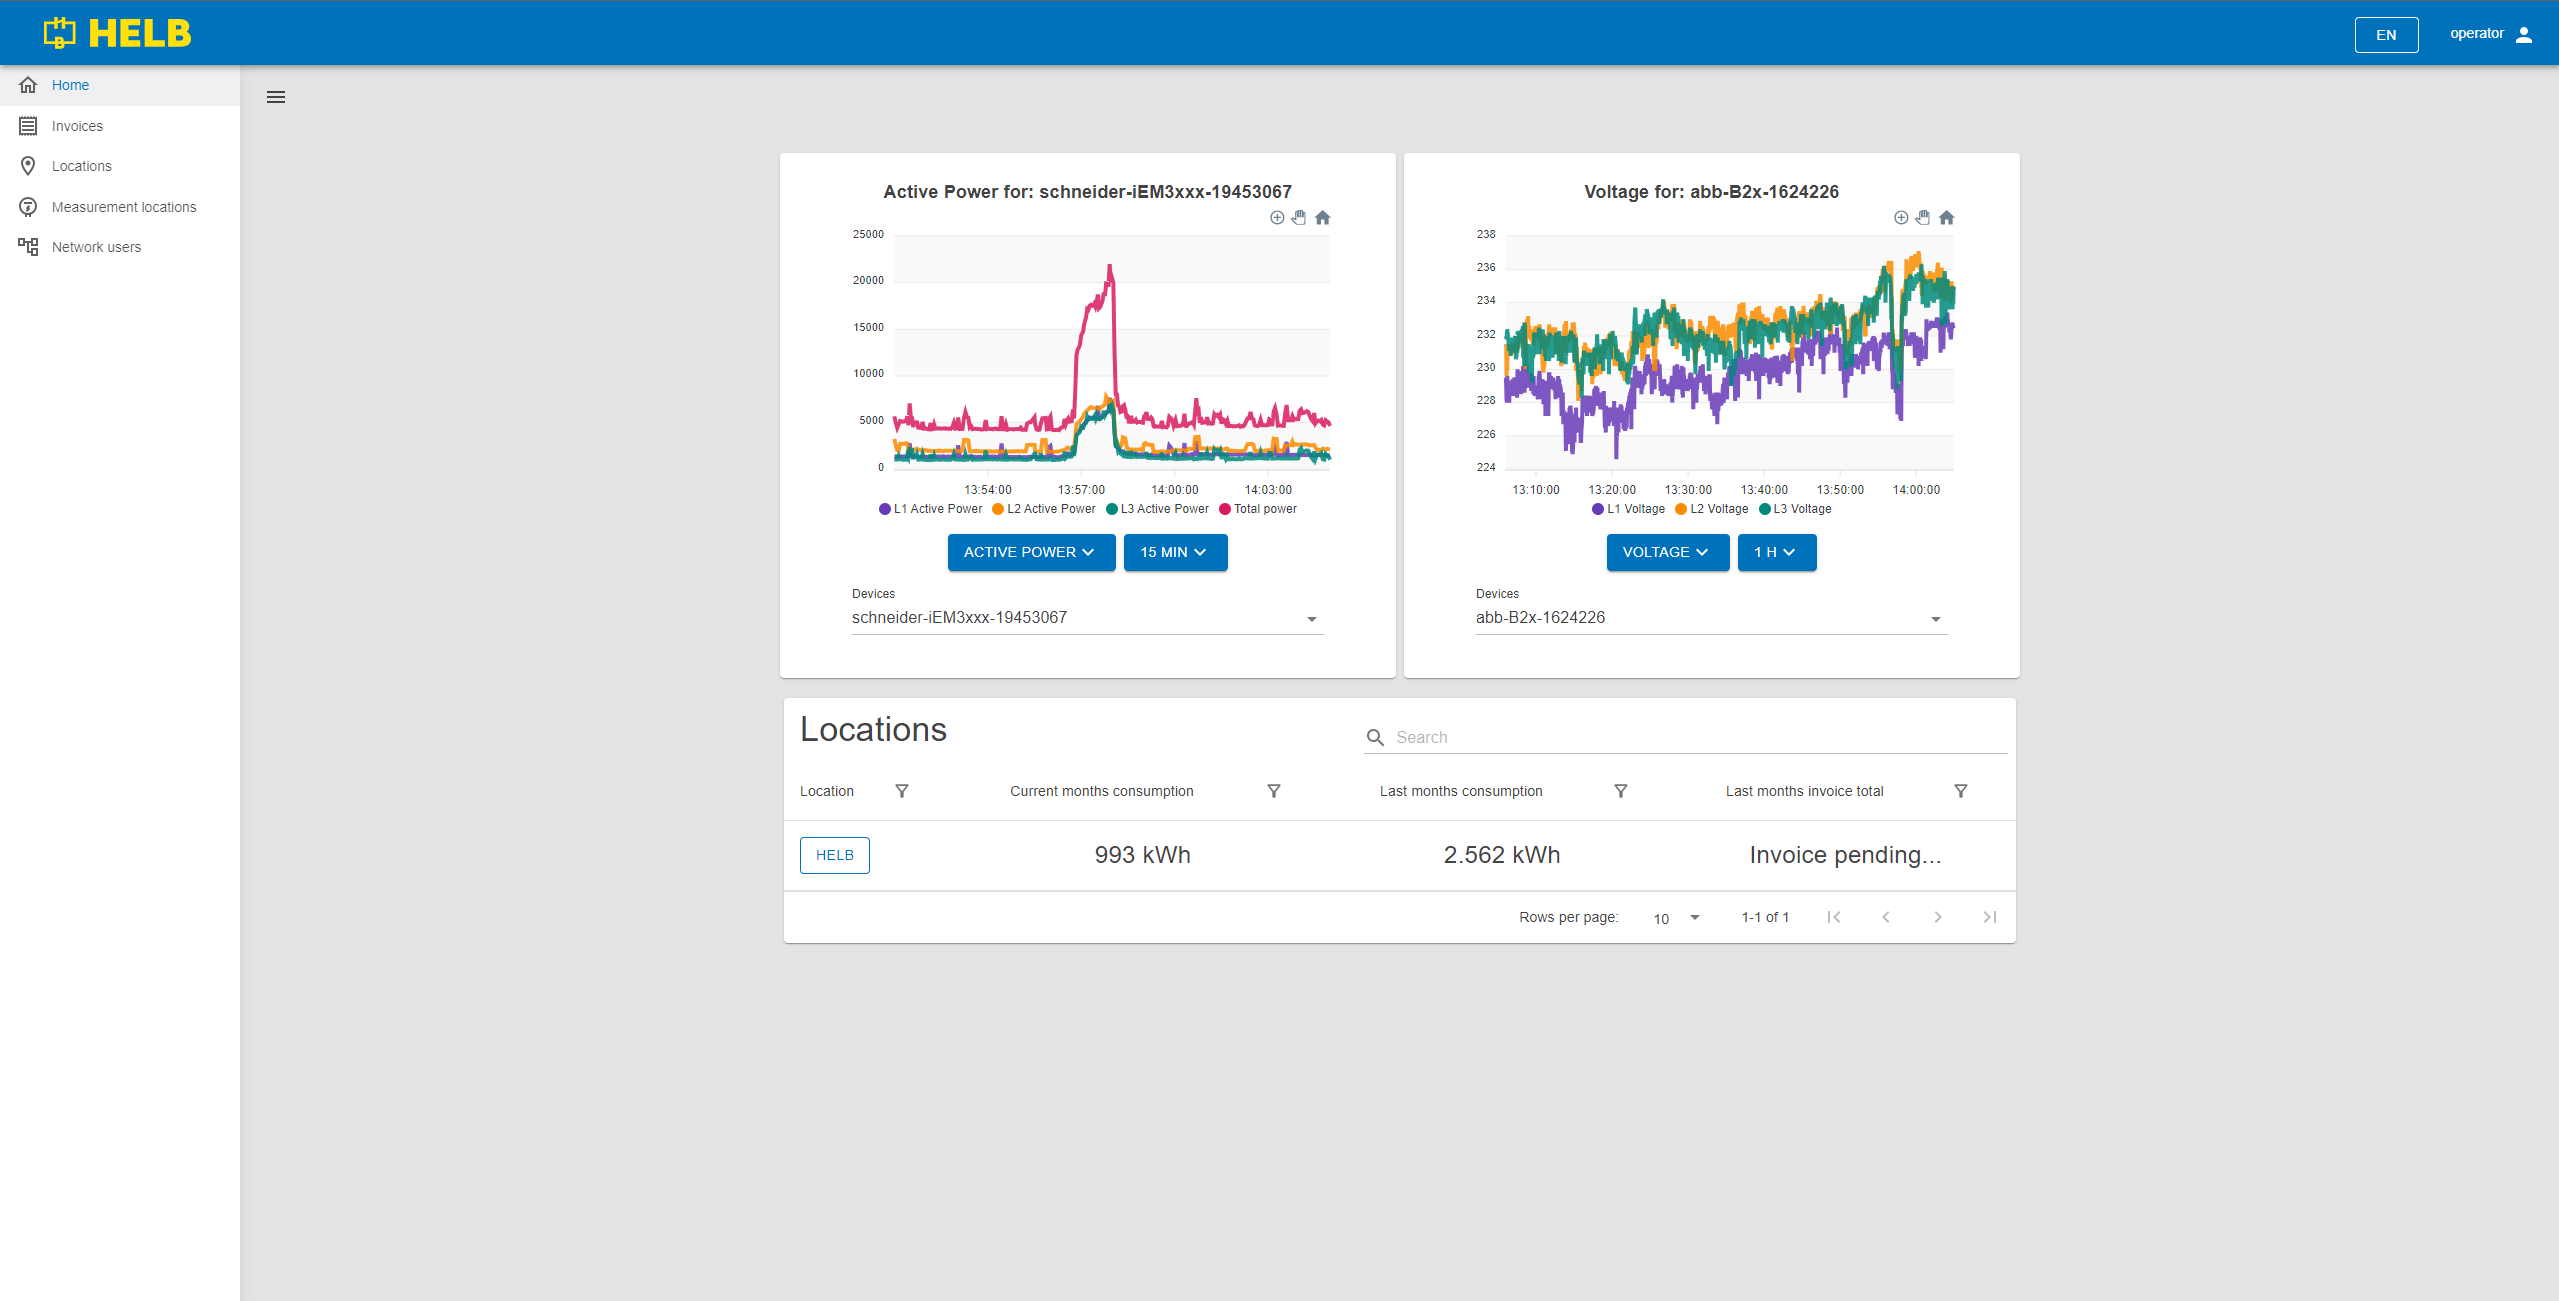
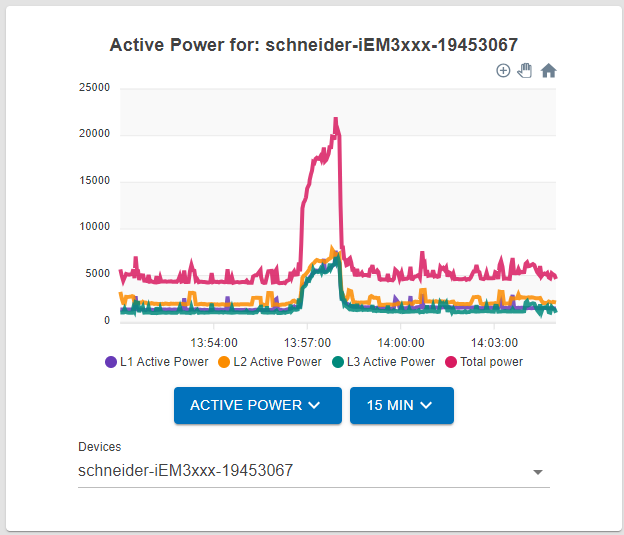
Operator Graph
This graph displays various data for any device in the network. By changing the settings on each graph, users can get an accurate overview of the function of any device in the network.
There are two dropdown menus and an auto-completing text box.
The left dropdown allows the user to select the type of data they want to see.
The right dropdown allows the user to change the time scale of the data visualization in steps of 15 minutes, 1 hour, 6 hours, and 24 hours.
The auto-completing text box labeled "Devices" allows the user to select which device's data will be displayed.
 Operator
Graph
Operator
Graph
Location Table
This table shows all locations the current user can oversee.
The user can see the name of each location, its current month's consumption, last month's consumption, and last month's invoice total.
By clicking on the name of the location, the user can inspect that location's data.
 Location Table
Shared pages
The site is built with modular components arranged into pages.
Depending on the user type, different pages are available or display slightly differently.
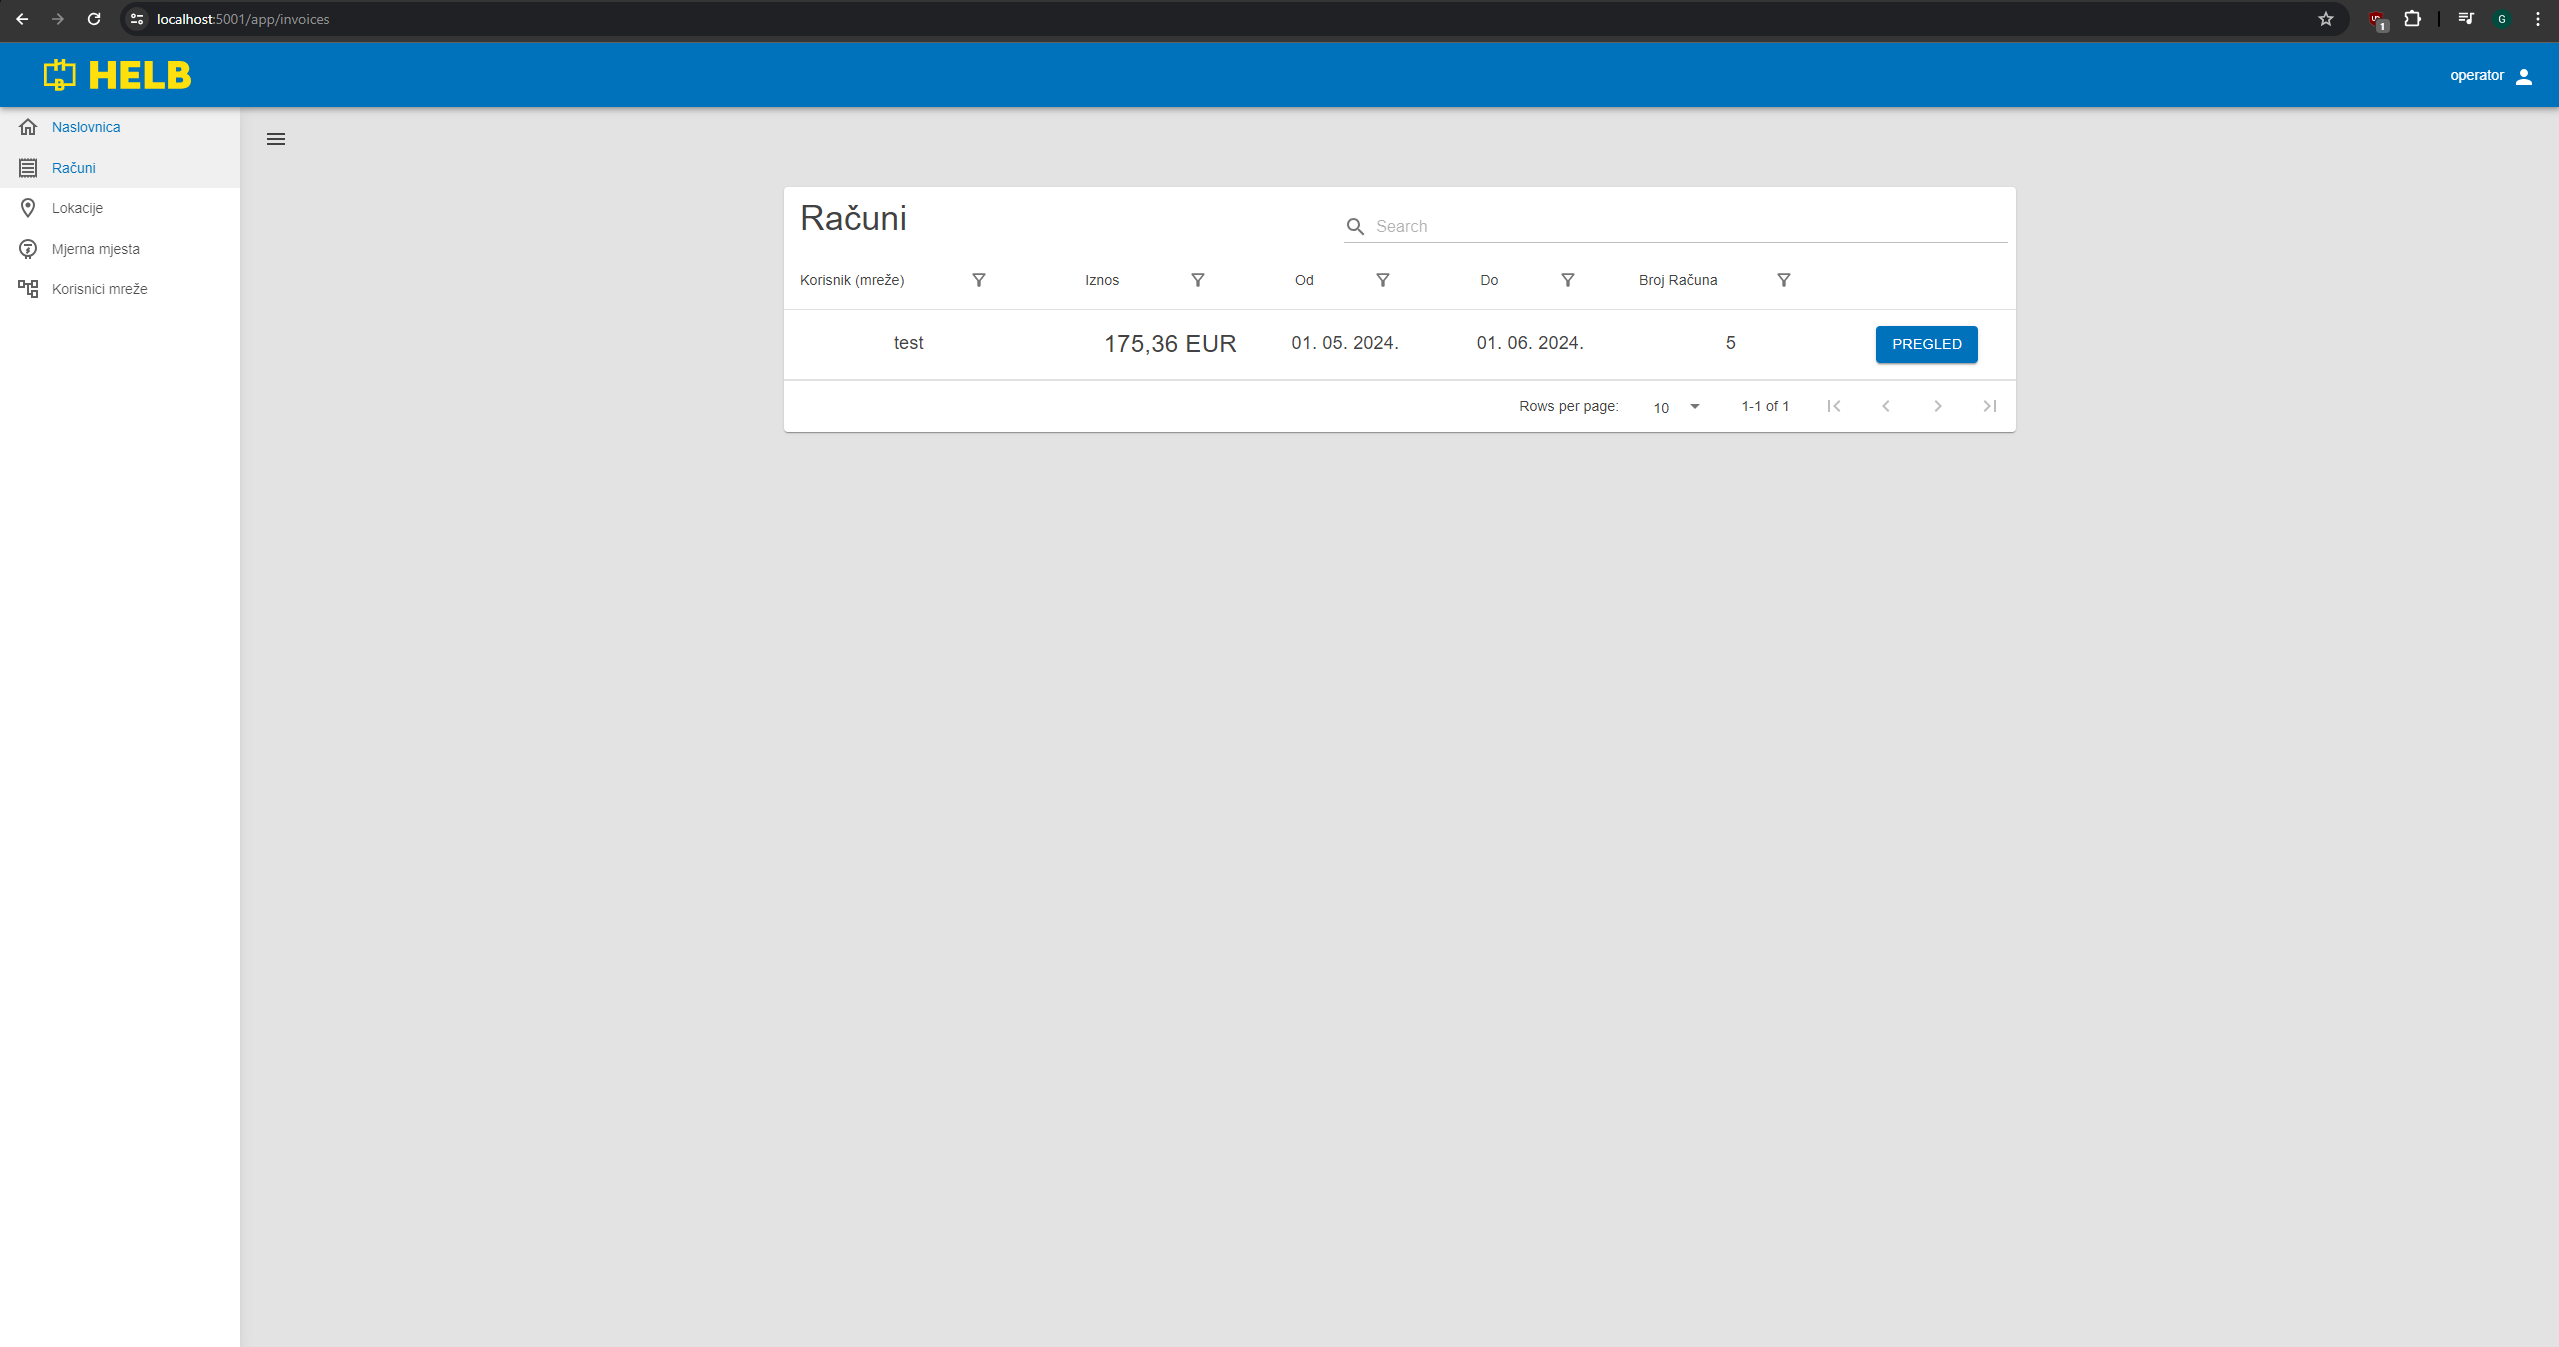
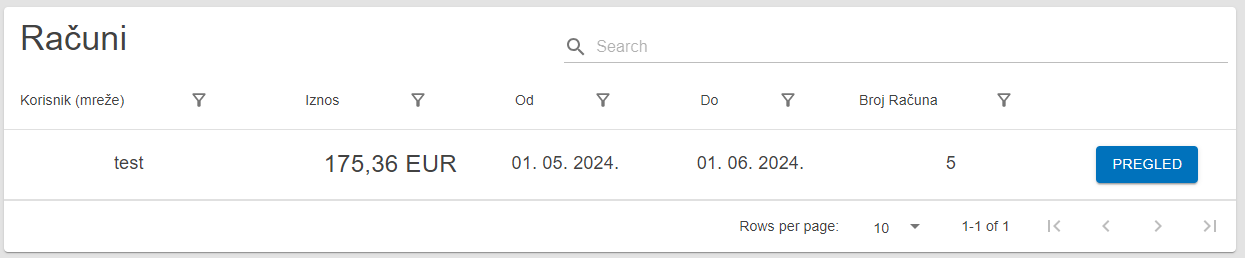
Invoices
This page holds the Invoices table and is used to find and review invoices.
Content
 /app/invoices
Invoices Table
This table shows all invoices the current user can oversee.
The user can see the name of the network user this invoice is directed at, the total amount in EUR, the start and end time of the billing period, and the invoice number.
By pressing the inspect button, the user can see a more detailed overview of the invoice and even print it out.
 Invoices Table
Measurement locations
This page contains the Measurement Locations table and is used to find and review measurement locations.
Content
 /app/meters
Network Users Table
This table shows all measurement locations the current user can see.
The user can see the name of the location, network user, and device at that measurement location. The table also displays the current month's consumption, last month's consumption, and last month's invoice total for those measurement locations.
By clicking on the name of the location or network user, the user can inspect the details of that entity.
Clicking on a device redirects to a detailed overview of individual measurement locations.
 Measurement Locations Table
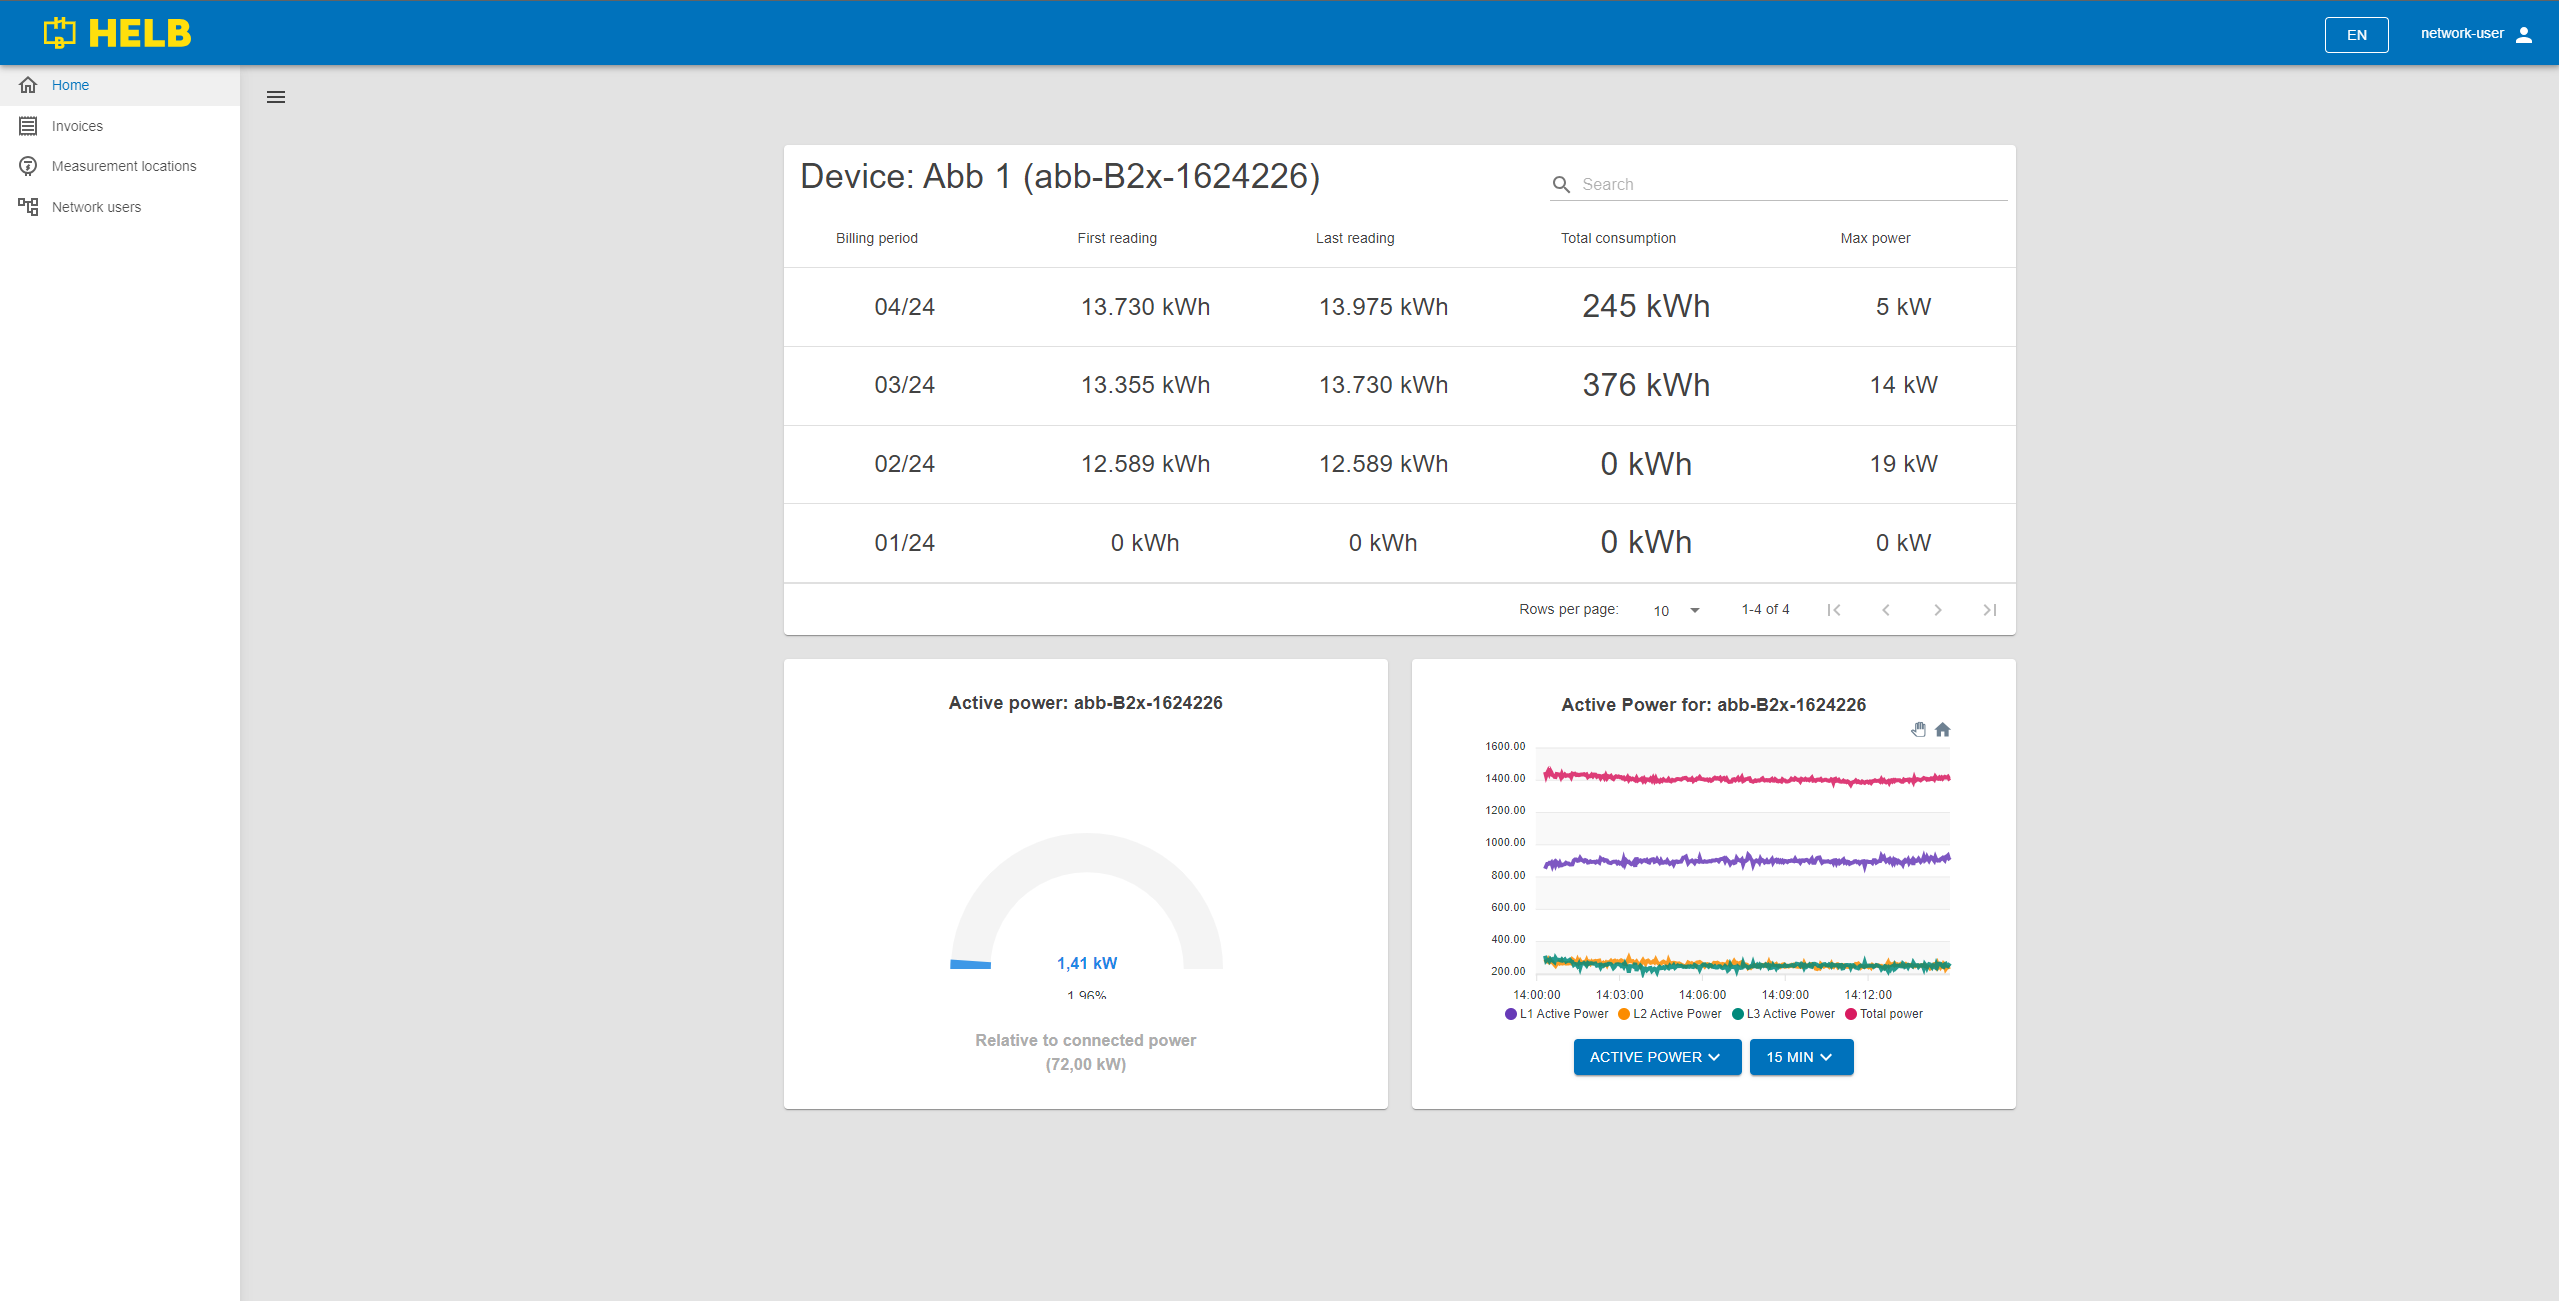
Meter details
This page shows detailed stats for the selected meter with real-time displays.
Content
 /app/meter/{id}
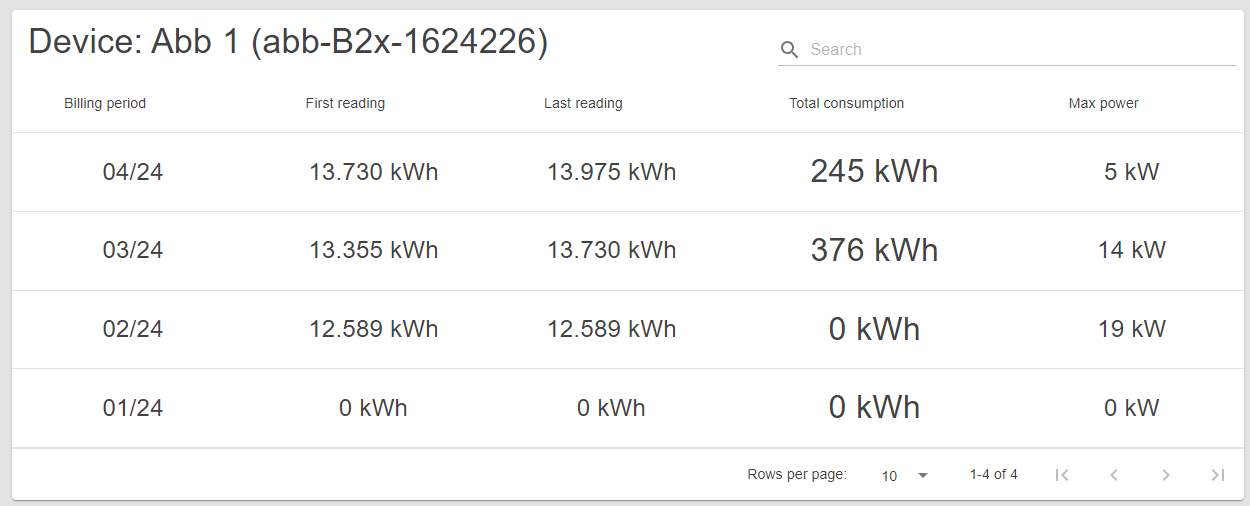
Meter Table
This table shows important data about the meter organized by billing period.
The user can see the billing period, first and last reading, total consumption for that billing period, and the maximum power measured within that billing period.
 Meter Table
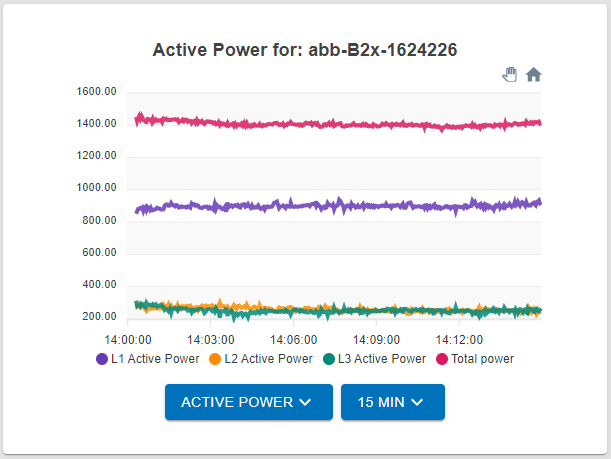
Meter Graph
This graph shows various data for this specific device. By changing the settings, users can get an accurate overview of the device's function.
There are two dropdown menus.
The left dropdown allows the user to select the type of data they want to see.
The right dropdown allows the user to change the time scale of the data visualization in steps of 15 minutes, 1 hour, 6 hours, and 24 hours.
This display updates in real time!
 Meter Graph
Meter Gauge
This gauge shows the current active power compared to the connected power allowed by the device, which is set by the operator.
This display updates in real time !
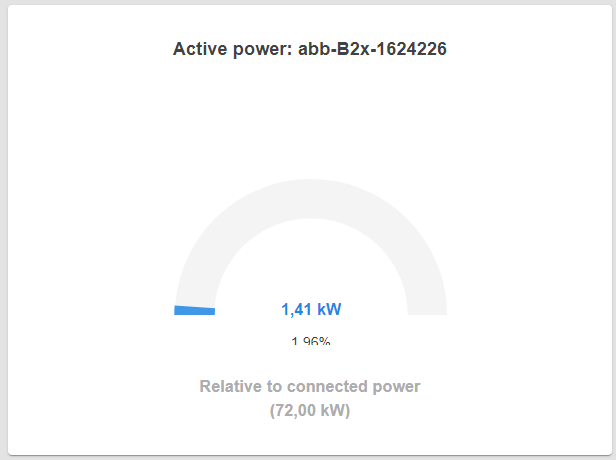 Meter Gauge
Network users
This page contains the Network Users table and is used to find and review network users.
Content
 /app/network-users
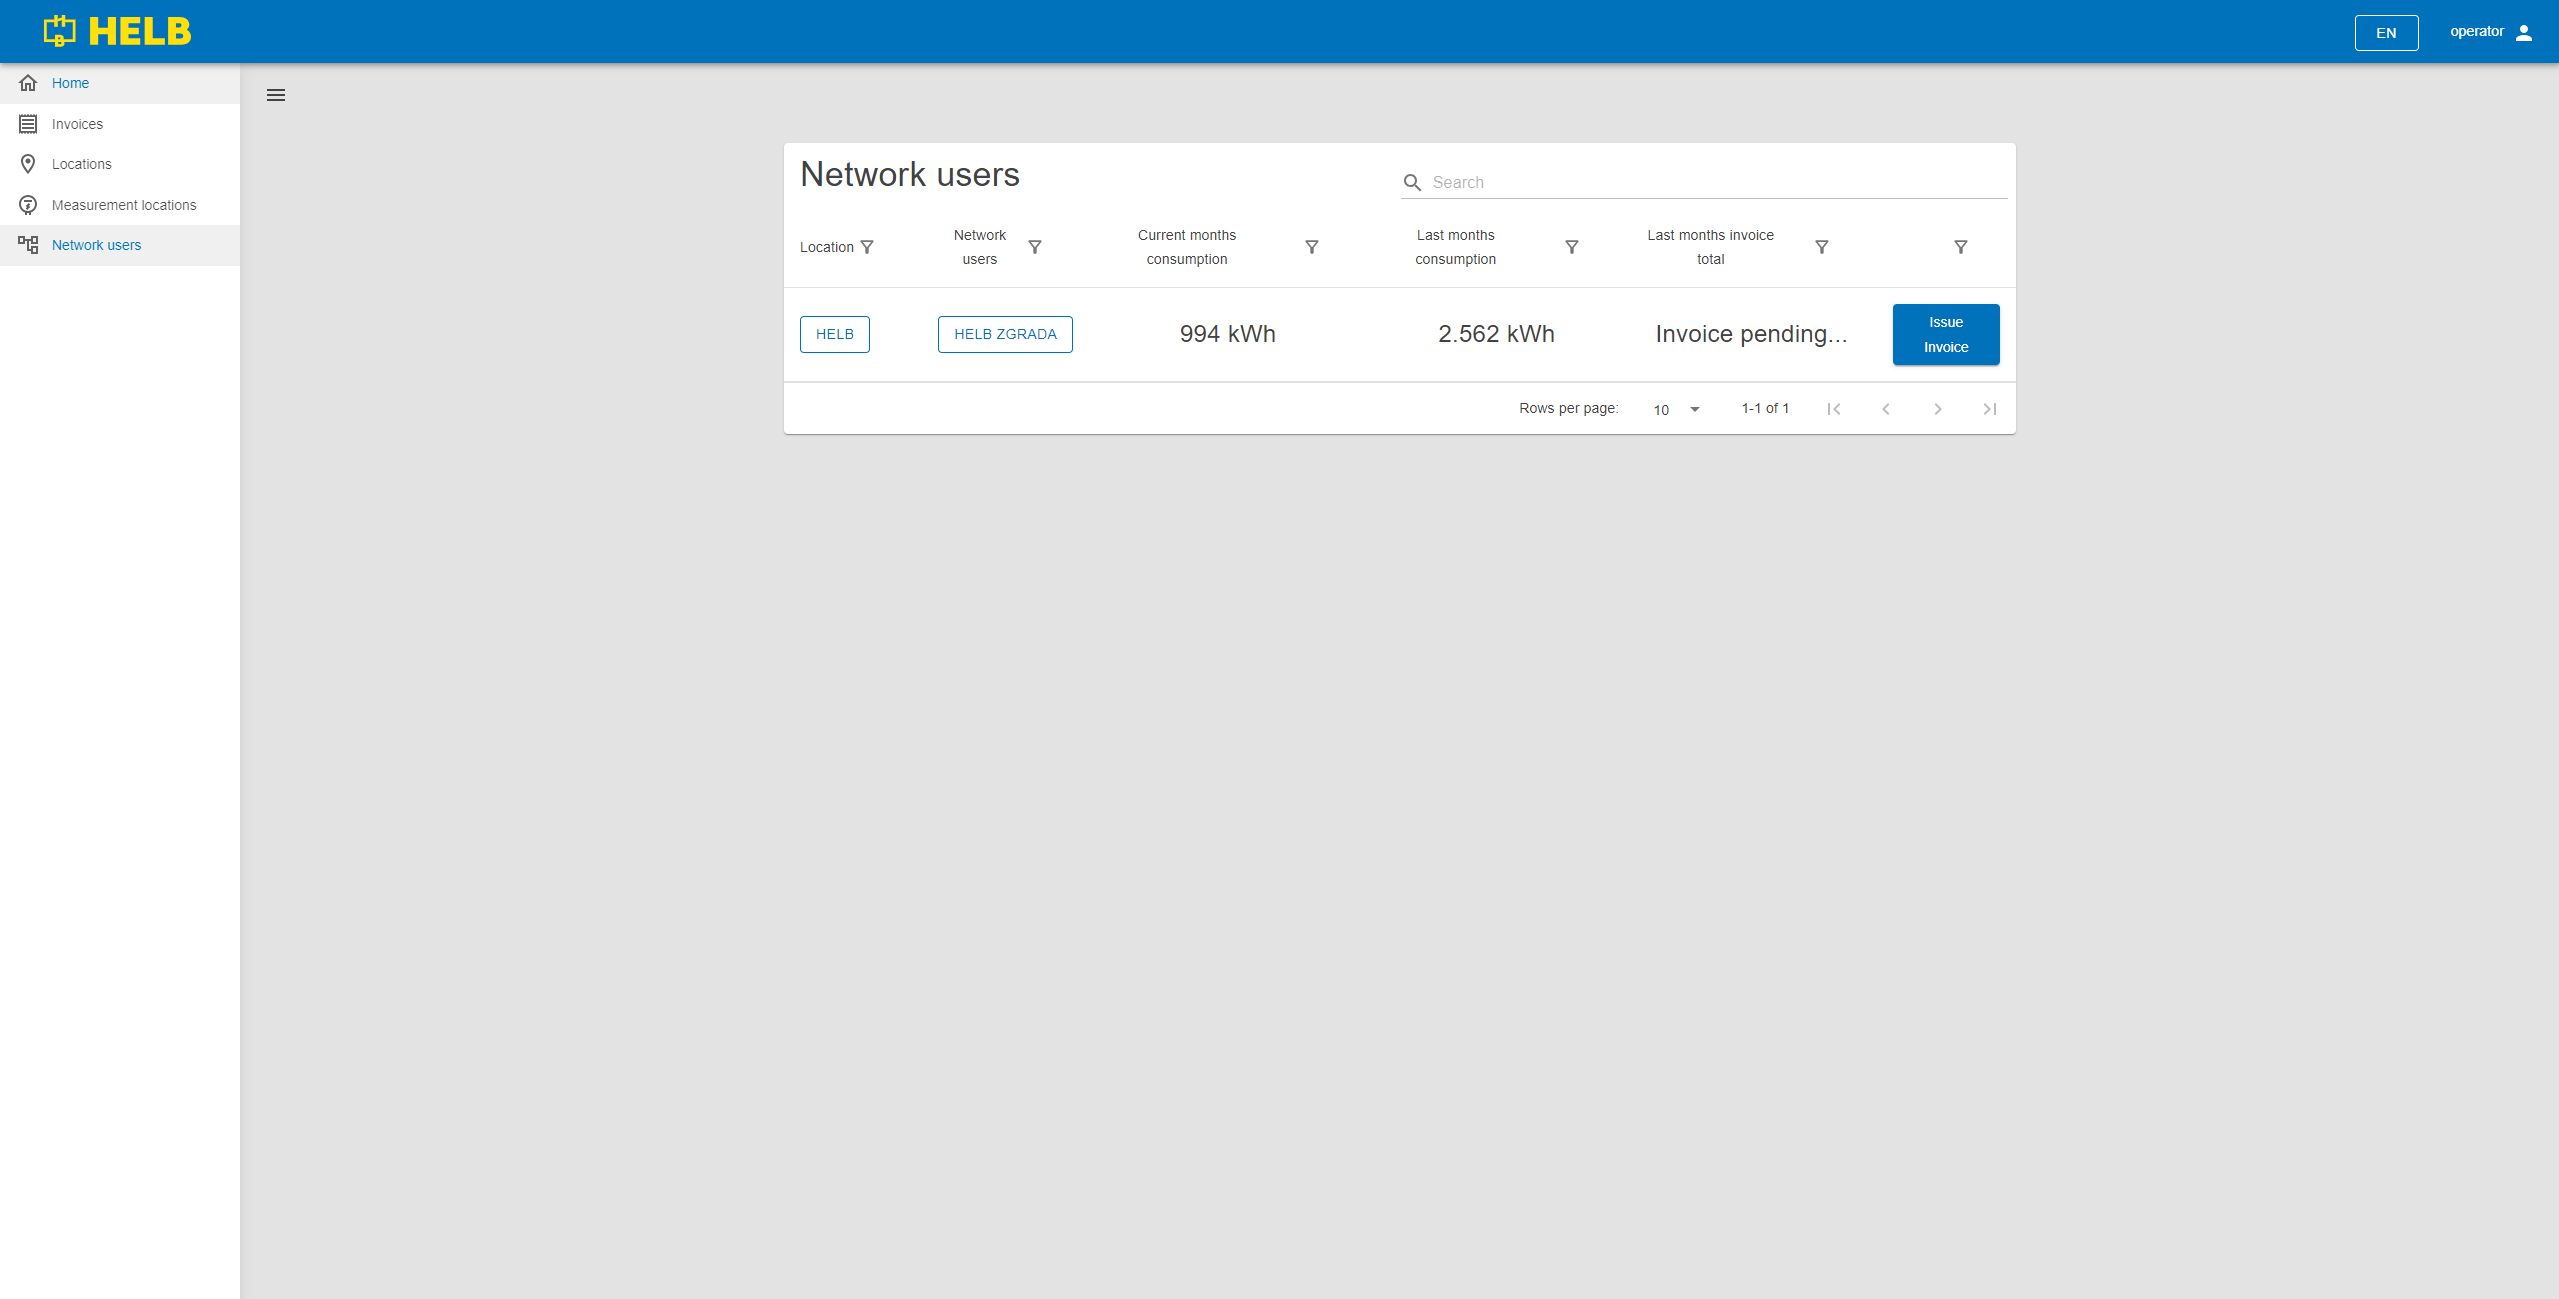
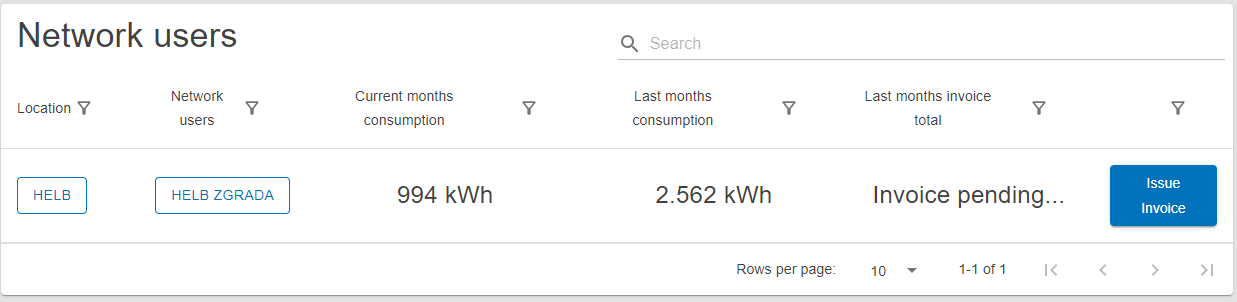
Network Users Table
This table shows all network users the current user can see.
The user can see the name of the location and the network user, as well as the current month's consumption, last month's consumption, and last month's invoice total for those network users.
By clicking on the name of the location or network user, the user can inspect the details of that entity.
Clicking on the "Issue Invoice" button allows the user to generate an invoice from the start of the month or the end of the last issued invoice to now. (Only Operators can do this, and no other users can see the button.)
 Network Users
Table
Network Users
Table
Architecture
The architecture of OZDS is a distributed system with multiple locations. The system consists of a server running the ASP.NET Core application, a PostgreSQL database, and multiple locations with meters. The meters are connected to the server via a Raspberry Pi acting as a messenger. The server receives data from the meters and stores it in the database. The server also serves the web application to clients.
The server hosts the ASP.NET Core application, which is divided into three main parts:
- Ozds.Data: Data access layer
- Ozds.Client: Client application
- Ozds.Business: Business logic
Here is the full deployment graph for OZDS:

Scripts
This is documentation for the various scripts used for development defined in the justfile.
Install just,
docker,
node, dvc,
dotnet
and nushell. Prepare dvc by asking a fellow
developer and run just prepare from the command line before running any other
script.
just prepare
This script installs installs prettier if not available, dotnet packages and tools and runs the PostgreSQL database using docker compose in the background.
just ci
This script is only used for CI and is not intended for developers. It installs dotnet tools and prettier if not available.
just dev
This script starts a dotnet process that starts up Ozds.Server and watches for
changes in the solution providing hot reloading of the server.
just fake
This script runs the fake project that sends fake measurements to the local server.
just format
This script formats every file in the repository using
dotnet jb
tool for C# and Razor files and prettier for everything
else and is used on CI to keep the OZDS repository formatted on every PR.
just lint
This script lints the repository by checking formatting with
prettier and using
dotnet jb
tool to check for warnings and errors in C# and Razor files.
just test {*args}
This script tests C# code with the dotnet test command.
just migrate {name}
This script generates a migration in the data project using the
dotnet ef tool.
just publish
This script compiles the solution for release inside the artifacts directory
using the dotnet publish command.
just clean
This script cleans Orchard Core App Data files, removes all docker containers and volumes and starts them back up.
just purge
This scripts does the same as just clean except that, in addition, it uses
git clean to remove any compiled artifacts and restores all dotnet tools and
packages.
Workflows
Workflows are series of actions the server or developer takes that implement a specific functionality. These are a great way to show how data flows through the application.
Auditing
Auditing is the process of tracking changes to auditable data such as locations and network users via audit events. Audit events are created by the server each time auditable data is created, updated, or deleted. These events are stored in the database and can be queried to determine who made the change, when the change was made, and what the change was.
Auditing is implemented via a query interceptor that creates an audit event each time auditable data is created, updated, or deleted.

Billing
Billing is the process of issuing invoices to network users and locations. Only network user billing is currently implemented. Currently, operators can issue invoices on demand for the last billing period (last month).
Billing is implemented via a set of classes that calculate different parts of the invoice depending on measurement locations and tariffs.

Deployment
Deployment is done via github actions. The deployment workflow is defined in
.github/workflows/deploy.yml. The workflow is triggered on push to the main
branch. The workflow builds the OZDS web application and uploads it to an Azure
App Service.

Faking
Faking measurements is done in two modes: pushing and seeding. In push mode, measurements are faked continuously and sent to the server. In seed mode, measurements are faked for a specified interval (e.g. last week) and sent to the server in large batches as fast as possible.
Pushing
Pushing is a continuous process that sends measurements to the server every specified interval (e.g. last minute) for measurements in that interval. The requested interval is first projected into the time of the CSV file and then the records are projected into the future.

Seeding
Seeding is a one-time operation that sends measurements to the server for a specified interval (e.g. last week) in large batches as fast as possible. This is accomplished the same way as pushing, but the requests are sent once without waiting for the next interval.

Login
Login is a simple workflow that starts a user session and directs them to the correct page based on their role. There are two types of users the login workflow differentiates between: admin and regular users. Admin users (mostly developers) are redirected to the admin page, while regular users are redirected to the app page.

Migration
Migrations are generated via dotnet ef but to prepare the database and test if
migrations went well, there is a bit more to do.

Moderation
Moderation, in the context of OZDS, is the act of user management including user creation and modification. For now, an admin is required to create a user and then the user data can be modified by other users. This is because we are using OrchardCore for user management and the easiest route, for now, was to use OrchardCore UI to create users and then join our representative table with OrchardCore user tables in the database. In the future, we strive to make this process streamlined via registration and authorization of specific users making other users.

Push
Messengers push measurements from meters via the push API to the server.
The measurement insertion process is rather simple as it only requires JSON deserialization and mapping from measurement push models to measurement database entities before the insertion can happen.
The complicated part is creating aggregates over the measurements. We are aware
that TimescaleDB has a continuous aggregate feature that can be used to do
this automatically in the database, however, this requires a community
TimescaleDB license and this is not available in the Azure cloud. Therefore,
we have implemented a query interceptor that first converts measurements to
aggregates, merges them on the server and then upserts them in the database. The
merge process is required because aggregates have a composite primary key
consisting of their timestamp, meter id, and interval which means that, without
merging on the server, multiple instances of the same aggregate may be present
in one query which is not allowed.
There is one major drawback to our approach. Since Entity Framework Core
doesn't yet support upserts we had to use a separate library for that. The
library we use for database upserts does not support upserting in the same query
as measurement insertion. This means that every measurement push results in two
queries to the database. One for inserting measurements and one for upserting
aggregates. This is not ideal but it is the best we could do with the current
state of the libraries we use.

OZDS project structure
The C# solution of the OZDS repository contains several projects each serving a different purpose. Here is an outline of every project
Ozds.Data
This project contains the database schema and queries and nothing else. The
DataDbContext class contains all database tables and the OzdsDbClient
contains all the queries needed for the OZDS server. All the entities (tables)
are situated in the Ozds.Data.Entities namespace.
Ozds.Business
This project is the layer that sits between the Ozds.Server and Ozds.Data.
Any logic that has to sit between the server actions and queries goes here and
is organized in services that are added to the DI container. Every function
defined in this project is tested by the unit tests in the Ozds.Business.Test
project.
Ozds.Server
This project is the startup project and contains all API controllers and the
entry point for the Ozds.Client project. The complexity in this project should
come only from the UI and any backend logic should be kept in the
Ozds.Business project.
Ozds.Client
This project contains all the UI Razor files that will present data to the end
users. The complexity in this project should be kept at a minimum and any
extraneous logic should be kept in the Ozds.Business project.
Ozds.Business.Test
This project tests everything in the Ozds.Business project and mimics its
structure.
Ozds.Fake
This project is treated as a script that generates fake measurements for the
server. The complexity in this project should be kept at a minimum and this
project should use the Ozds.Server project to mimic the measurement structure.
Ozds.Business
This project contains all of the backend logic of the server. Critical functions
in this project is tested in the Ozds.Business.Test project. Logic is divided
into namespaces conceptually similar to each other (ie. all logic regarding
conversion is in the Conversion namespace).
For each namespace an Abstractions namespace is present which contains
interfaces that should be used in consuming code. If there is a Agnostic
namespace it should be used instead because it automatically handles logic for
picking the right implementation of the interface. For example, the
AgnosticModelEntityConverter will pick the right implementation of
IModelEntityConverter based on the type of the entity or model.
Ozds.Business.Aggregation
This namespace contains client-side and server-side aggregation upsert logic. The server-side logic is used to tell the database how to upsert aggregates via LINQ Expressions over database entities and the client-side logic mimics this as a method over business models . If we were just to use the server-side logic, the database would complain that it couldn't upsert the same aggregate twice in the same transaction. This is why we have to upsert first on client-side the aggregates that are to be inserted and then upsert the aggregates that are on the server.

Ozds.Business.Capabilities
This namespace is a WIP but will be used to detect which meter measures which measures.
Ozds.Business.Conversion
This namespace contains converters for:
- Database entities ↔ business models

- Push requests ↔ measurement models

- Measurement models → aggregate models

Ozds.Business.Finance
This namespace contains billing logic. There are three levels of billing calculations needed for every invoice:
- Invoice level: this is the top level corresponding to a network user or location and uses lower levels to calculate the totals and subtotals on an invoice

- Calculation level: each invoice has a set of calculation corresponding to a measurement location and uses the lowest level to calculate the totals and subtotals of a particular calculation

- Calculation item level: each calculation has a set of calculation items corresponding to a certain billing item and calculates the amounts and totals of a particular billing item

For now, only network user invoice calculation is implemented.

Ozds.Business.Interceptors
This namespace contains interceptors to any request sent to the database and implement various business logic:
AggregateCreationInterceptor: intercepts any request to the database containing measurements and creates aggregates for them.AuditingInterceptor: intercepts any request to the database that mutates entities that are auditable, mutates their audit fields and creates an audit event depending on the type of mutation done on the entity.CascadingSoftDeleteInterceptor: this interceptor is a WIP but it is meant to implement soft delete logic for auditable entities.InvoiceIssuingInterceptor: intercepts any invoice creation request and mutates the issuing fields on that invoice.ReadonlyInterceptor: throws an exception any time an attempt to mutate a readonly entity is made.ServedSaveChangesInterceptors: this is a base type for interceptors that is hooked up to provide inheritors with aIServiceProvider.

Ozds.Business.Iot
Contains logic for handling IoT requests. It only handles pushing for now
(OzdsIotHandler), but it will be split into a Push and Poll interface once
we get around to implement polling.
Pushing is the process of IoT devices sending measurements to the server. It is implemented via a REST API that the IoT devices can call. The IoT devices send measurements which then get aggregated and stored in the database.

Polling is the process of IoT devices asking the server for newly updated configuration. This way we bypass the need to send anything to IoT devices which is problematic in todays internet because of technologies like CGNAT. It is meant to be implemented as a REST API that the IoT devices can call. The IoT devices asks for updated configuration and the server responds with the updated configuration from the database.
Ozds.Business.Math
Contains logic for manipulating electrical measures. This is a critical part of the application that much of the application depends on and is tested thoroughly.
There are three different dimensions each measure can have:
- Phase: a measure can be a single phase or triphasic measure.

- Direction: a measure can be an import or export measure and these correspond to user consumption and production. It can also be any duplex measure if it is a measure of current or voltage since these are not directional.

- Tariff: a measure can be a high tariff and a low tariff or a single tariff measure. This is used to calculate the cost of the measure depending on the time of day.

The measure structure is such that the tariff hierarchy classes contain directional hierarchy classes which contain phase hierarchy classes. All three of these class hierarchies also contain a null class which is used to represent a measure that is not set. These hierarchies also contain a composite class which is used to represent a measure that is a combination of two or more measures. This is used to represent the different ways in which a measure is stored or calculated for better accuracy. For example, we might store a measure as three phases but also as a single phase and for some calculations one is more accurate than the other.
There are two more top-level class hierarchies:
- Span: a measure can be a measure over a certain time span. This is used to calculate the costs over a span of time.

- Expenditure: a measure can be an amount used to calculate costs. For network user invoice calculations this means it can be either used to calculate supply or usage costs and is used to represent these two different types of costs.

Ozds.Business.Models
Contains business models that are used to represent entities in the database.
Entities in the database are represented as entity classes in the
Ozds.Data.Entities namespace which are then converted to business models in
this namespace. The reasoning is that the database entity classes have special
fields or properties that instruct Entity Framework Core how to handle database
operations that should not be exposed to the rest of the application. On the
other hand, business models have special fields and properties and implement
interfaces which should not be represented in the database.
There are a couple of marker interfaces that are used to represent the different aspects of models:
- Identifiable: models with an identifier. Additionally, all models that are identifiable should have a title which is a nice addition to display them in the UI.

- Readonly: models that are readonly and should not be mutated.

Models are divided into a few of class hierarchies:
- Auditable: models that can be audited. Any time a mutation is done on an auditable entity, an audit event is created and the audit fields on the entity are updated.

- Events: models that represent events like when an auditable entity is mutated.

- Measurements: models that represent measurements that are sent by IoT devices.
In order to use models from multiple device types all measurement models are
required to implement the different measure properties on
IMeasurement.

- Aggregates: models that represent aggregates of measurements. In order to use
models from multiple device types all aggregate models are required to
implement the different measure properties on
IAggregate. TheTimestampis always the start of the span of the aggregate. TheCountis the number of measurements that were aggregated. The nonSpanningMeasureenergy properties are the values of the last measurement in the span while the nonSpanningMeasurenon energy properties are the average values of the measurements in the span.

- Invoices: models that represent invoices that are sent to network users.

- Calculations: models that represent calculations that are used to calculate the totals and subtotals on an invoice.

In addition, all class hierarchies implement IValidatableObject.
Ozds.Business.Mutations
Contains classes that wrap database requests in functions that mutate data.
These are separate from other requests in Ozds.Business.Queries because
mutations are always more sensitive and should be handled with care. All the
classes use AgnosticModelEntityConverter from Ozds.Business.Conversion to
convert the mutated business models to database entities and DataDbContext
from Ozds.Data to mutate data in the database.
Most mutations are done via agnostic classes that operate on class hierarchies
in Ozds.Business.Models:
- Auditable: mutations that mutate auditable entities.

- Events: mutations that mutate events. This class hierarchy is readonly so only the create mutation is implemented.

- Measurements: mutations that mutate measurements. This class hierarchy is readonly so only the create mutation is implemented.

- Aggregates: mutations that mutate aggregates. This class hierarchy is readonly so only the create mutation is implemented.

- Invoices: mutations that mutate invoices. This class hierarchy is readonly so only the create mutation is implemented.

- Calculations: mutations that mutate calculations. This class hierarchy is readonly so only the create mutation is implemented.

Ozds.Business.Queries
Contains classes that wrap database requests in functions that query data. These
are separate from other requests in Ozds.Business.Mutations because queries
are always less sensitive and should be handled with less care. All the classes
use DataDbContext from Ozds.Data to query data in the database and
AgnosticModelEntityConverter from Ozds.Business.Conversion to convert the
queried database entities to business models.
Query classes use the PaginatedList<T> class that makes it easier to paginate
the results of a query.

Query classes also use the Z.EntityFramework.Plus.EFCore nuget package to make
where and order by clauses agnostic over the type of entity. This makes the code
more brittle but for now it is a quick and dirty solution to get started before
we convert everything to use standard LINQ expressions.
Most queries are done via specifically implemented classes but a lot can be
queried via agnostic classes that operate on class hierarchies in
Ozds.Business.Models:
- Auditable: queries that query auditable entities.

- Events: queries that query events.

- Measurements: queries that query measurements.

- Aggregates: queries that query aggregates.

- Invoices: queries that query invoices.

- Calculations: queries that query calculations.

Ozds.Business.Time
Contains all logic for handling time. This is a critical part of the application that much of the application depends on and is tested thoroughly.
Ozds.Client
This project holds all the UI pages and reusable components needed to render the
UI. Pages are kept in the Pages namespace and reusable components are kept in
the Shared namespace. Pages in the Pages namespace are kept at minimum
complexity, contain only one route, and most UI logic is kept in the reusable
components. Reusable components only contain UI logic and any backend logic is
kept in the Ozds.Business project.
Ozds.Client.Base
Contains base component and layout component classes for the UI. These classes provide functions that make it more convenient to serialize dates, measures and localize text.

Ozds.Client.Pages
Contains pages rendered by the UI. Pages are better explained in other parts of the documentation.
Ozds.Client.Shared
Contains reusable components. Reusable components are spread across multiple namespaces each for a different purpose:
-
Models: contains components directly tied to individual models in the
Ozds.Businessproject. These are components used to view and potentially edit and audit models. -
Print: contains components used to render pdf documents. These only contain components used to render invoices for now.
-
Layout: contains components used to render the layout of the UI. These components are used to render the header, footer, and other common parts of the UI.
Ozds.Server
This project holds the entry point to the Ozds.Client project and all
necessary API controllers. The controllers reside in the Controller namespace.
Every controller action is authorized and should only wrap inputs and outputs of
particular functions inside Ozds.Business.
Ozds.Server.Controllers
There are a couple of marker interfaces that are used to implement the UI and API:
-
App: this is the entrypoint to the UI of the application and it serves pages from the
Ozds.Clientproject. It is used to serve theindex.htmlfile and all other static files that are needed to render the UI. -
IOT: entrypoint to the
pushandpollactions which are needed to push measurements to the database and poll configuration for messengers.
Ozds.Data
This project contains all entities and queries for the database. The entities
are kept in the Entities namespace and queries are functions in the
OzdsDbClient class. The class is partial and it is divided into conceptually
similar files (ie. all queries for meters are in the OzdsDbClientMeters.cs
file).
Schema
The schema is generated using mermerd when it is
migrated to the latest migration generated by dotnet ef.
Ozds.Data.Entities
Contains entities that are used to represent tables in the database.
There are a couple of marker interfaces that are used to implement certain
functionality or interceptors in Ozds.Business:
- Readonly: marker interface used to implement read-only entities by throwing exceptions on mutations

- Aggregate: marker interface used to implement measurement aggregation. For now measurements are aggregated in quarter-hourly, daily and monthly intervals.

- Measurement: marker interface used to implement aggregations over measurements.

Apart from the marker interfaces, entities can be grouped in a few class hierarchies. Virtual properties on entity classes are navigation properties to other entities they have a relationship with and are not kept in the database. These hierarchies make it easier to group entities that have similar mapping to database tables:
- Auditable: entities that can be audited. These entities also have soft delete functionality implemented via interceptors.

- Event: entities that represent events.

- Measurements: entities that represent measurements. Concrete measurement types have navigation properties to specific meter types.

- Aggregates: entities that represent aggregated measurements. The timestamp is the start of the interval and the count is the number of measurements in that interval. Concrete aggregate types have navigation properties to specific meter types.

- Calculations: entities that represent calculations. Calculations that don't have a issuer are issued automatically by the server.

- Invoices: entities that represent invoices.

Ozds.Data.Migrations
This namespace contains generated migrations for the database. The migrations
are generated using dotnet ef and are kept in the Migrations directory.
Ozds.Fake
This is a project intended only for development purposes. It is treated as a
script that pushes measurements to a development Ozds.Server instance. It has
two main modes:
-
push: pushes measurements to the server continuously from a CSV file. Depending on the requested meter id, it will pick a CSV file corresponding to that type of meter and push measurements to the server. The CSV files are loaded as embedded resources from theAssetsbut are tracked viaDVC. The CSV files have an arbitrary amount of measurements in an arbitrary time interval andOzds.Fakecorrects that for the current point in time. -
seed: seeds the database by pushing measurements as it usually would withpushbut for a requested interval of time immediately in big batches. This mode takes some time depending on the interval but it is well worth the wait depending on the testing scenario.
The project has a similar namespace structure to Ozds.Business and references
it in order to mimic the API data structure needed to push measurements.
Ozds.Fake.Client
Contains the client that pushes measurements to the server. It contains a single class with a single method that makes HTTP requests to the server.
Ozds.Fake.Correction
Correction logic when converting CSV records to measurements. So far, only
cumulative measure correction is needed and implemented via the
ICumulativeCorrector interface and classes that implement it.

Ozds.Fake.Generators
Generation logic for push request measurements. Generators deserialize CSV records, correct cumulatives and generate push request measurements within a specified time interval. The reason why generators do all this is because to correct cumulatives and generate push request measurements, knowledge about the whole dataset is needed. So far, only repeating CSV file generators are needed and implemented.

Ozds.Fake.Loaders
Loaders for different types for embedded resources. Currently only a CSV file
loader is needed and implemented. These loaders are then used by the
ResourceCache that caches the loaded resources. In the case of CSV files, the
loaded resource is a list of records.

Ozds.Fake.Records
Contains CSV record classes that are used to deserialize the CSV files and
correct cumulative measures. All concrete classes implement the
IMeasurementRecord interface.

Ozds.Business.Test
This project mimics the structure of Ozds.Business and tests critical
functions defined in Ozds.Business. So far, nothing has been tested but we
strive to test critical parts of the system as much as possible.
Testing
This section is dedicated to testing.
Unit tests are not documented in the wiki as they are too verbose, but some E2E tests that are vital to the project are documented here.
Push
According to the architecture, from the standpoint of the cloud server, there are multiple points from which errors can occur. Starting from the locations and going to the database, we can expect to see errors in these areas:
-
Raspberry PI -> Server: The Raspberry PI is responsible for sending data from the meters to the server. If the Raspberry PI loses connection to the server, the server will not receive any data. The Raspberry PI could also send incorrect data or not be authorized to send data.
-
Server: The server itself could stop working or have a bug that causes it to stop receiving data from the Raspberry PI.
-
Server -> Database: The server sends data to the database. If the database is down or there is no connection to the database or there are query problems, the server will not be able to store the data.
Failures
Here is a list of failures that can occur in the push process divided into areas:
-
Raspberry PI -> Server:
- Raspberry PI is not sending data
- Raspberry PI is sending incorrect data
-
Server:
- Server is not connected to the network
- Server throws an exception (software bug)
-
Server -> Database:
- Database is not connected to the network
- Database throws an exception (software bug)
Testing
To test resiliency in the push process, we can simulate failures in the following ways:
-
Raspberry PI not sending data: shut down the fake push script and see how the server behaves. The server should not stop working and create an alarm after some time.
-
Raspberry PI sending incorrect data: create CSV files with incorrect data from CSV files with correct data and fake push those measurements to the server. The server should not stop working and should create an alarm.
-
Server is not connected to the network: shut down the server and start it back up after some time. The server should start working again, not a single measurement should be lost (fake script should retry same as application), and an alarm should be created.
-
Server throws an exception: create a bug in the server that causes it to stop processing incoming measurements. The server should not stop working and create an alarm.
-
Database is not connected to the network: shut down the database and start it back up after some time. The server should start working again, not a single measurement should be lost (fake script should retry same as application), and an alarm should be created.
-
Database throws an exception: create a bug in the server that causes the database to stop processing incoming measurements. The server should not stop working and create an alarm.
Billing
As is shown in the billing workflow, billing is an orchestrated process that involves the cloud server, the database, and the Altibiz ERP server. With this in mind, we can identify the following points of failure:
-
Server -> Database: The server sends data to the database. If the database is down or there is no connection to the database or there are query problems, the server will not be able to store the data.
-
Server: The server itself could stop working or have a bug that causes it to stop from communicating to other services.
-
Server -> Altibiz ERP: The cloud server sends billing data to the Altibiz ERP server. If the Altibiz ERP server is down or there is no connection to the Altibiz ERP server or there are data problems, the cloud server will not be able to store the response. This point of failure will be expanded on when proper integration with the Altibiz ERP server is implemented.
Failures
Here is a list of failures that can occur in the billing process divided into areas:
-
Server -> Database:
- Database is not connected to the network
- Database throws an exception (software bug)
-
Server:
- Server is not connected to the network
- Server throws an exception (software bug)
-
Server -> Altibiz ERP:
- Altibiz ERP server is not connected to the network
- Altibiz ERP server is sending incorrect data
- Altibiz ERP server throws an exception (software bug)
Note that each failure could come up in different states of the billing process.
Testing
To test resiliency in the billing process, we can simulate failures in the following ways:
-
Database is not connected to the network: shut down the database and start it back up after some time. The server should start working again and all data should be stored correctly. If any operation is complete the server should continue those operations.
-
Database throws an exception: create a bug in the server that causes the database to stop processing incoming queries. The server should not stop working and create an alarm.
-
Server is not connected to the network: shut down the server and start it back up after some time. The server should start working again and all data should be stored correctly, and an alarm should be created. If any operation is complete the server should continue those operations.
-
Server throws an exception: create a bug in the server that causes it to stop processing incoming queries. The server should not stop working and create an alarm.
-
Altibiz ERP server is not connected to the network: shut down the fake altibiz server and start it back up after some time. The server should start working again and all data should be stored correctly, and an alarm should be created.
-
Altibiz ERP server throws an exception
Reports
2024 Q1 report
Requirements
Currently only Abb B2x and Schneider iEM3xxx devices are supported. Manuals for these devices were analyzed to determine the interfacing strategy.
The final solution involves using an on-premise Raspberry PI Model 4B to read measurement data from devices or gateways called a messenger. For now, a single messenger is planned to be used for each location, but this can be expanded to multiple devices for a location if needed for redundancy.
The messenger reads data from the devices using Modbus TCP/IP and sends the data to the server via a simple REST API. The server is a cloud-based server that is hosted on Azure.
The Modbus registers that are read from each device type were determined from their manuals as well as registers needed to configure current device tariff.
For Abb B2x devices, the following registers are read:
| Address | Kind | Name |
|---|---|---|
| 0x5B00 | u32 (Multiplied by 0.1) | Voltage L1 (Volts) |
| 0x5B02 | u32 (Multiplied by 0.1) | Voltage L2 (Volts) |
| 0x5B04 | u32 (Multiplied by 0.1) | Voltage L3 (Volts) |
| 0x5B0C | u32 (Multiplied by 0.01) | Current L1 (Amps) |
| 0x5B0E | u32 (Multiplied by 0.01) | Current L2 (Amps) |
| 0x5B10 | u32 (Multiplied by 0.01) | Current L3 (Amps) |
| 0x5B16 | s32 (Multiplied by 0.01) | Active Power L1 (Watts) |
| 0x5B18 | s32 (Multiplied by 0.01) | Active Power L2 (Watts) |
| 0x5B1A | s32 (Multiplied by 0.01) | Active Power L3 (Watts) |
| 0x5B1E | s32 (Multiplied by 0.01) | Reactive Power L1 (VAr) |
| 0x5B20 | s32 (Multiplied by 0.01) | Reactive Power L2 (VAr) |
| 0x5B22 | s32 (Multiplied by 0.01) | Reactive Power L3 (VAr) |
| 0x5460 | u64 (Multiplied by 10) | Active Power Import L1 (Wh) |
| 0x5464 | u64 (Multiplied by 10) | Active Power Import L2 (Wh) |
| 0x5468 | u64 (Multiplied by 10) | Active Power Import L3 (Wh) |
| 0x546C | u64 (Multiplied by 10) | Active Power Export L1 (Wh) |
| 0x5470 | u64 (Multiplied by 10) | Active Power Export L2 (Wh) |
| 0x5474 | u64 (Multiplied by 10) | Active Power Export L3 (Wh) |
| 0x5484 | u64 (Multiplied by 10) | Reactive Power Import L1 (VARh) |
| 0x5488 | u64 (Multiplied by 10) | Reactive Power Import L2 (VARh) |
| 0x548C | u64 (Multiplied by 10) | Reactive Power Import L3 (VARh) |
| 0x5490 | u64 (Multiplied by 10) | Reactive Power Export L1 (VARh) |
| 0x5494 | u64 (Multiplied by 10) | Reactive Power Export L2 (VARh) |
| 0x5498 | u64 (Multiplied by 10) | Reactive Power Export L3 (VARh) |
| 0x5000 | u64 (Multiplied by 10) | Active Energy Import Total (Wh) |
| 0x5004 | u64 (Multiplied by 10) | Active Energy Export Total (Wh) |
| 0x500C | u64 (Multiplied by 10) | Reactive Energy Import Total (VARh) |
| 0x5010 | u64 (Multiplied by 10) | Reactive Energy Export Total (VARh) |
| 0x5170 | u64 (Multiplied by 10) | Active Energy Import Total T1 (Wh) |
| 0x5174 | u64 (Multiplied by 10) | Active Energy Import Total T2 (Wh) |
For Schneider iEM3xxx devices, the following registers are used:
| Address | Kind | Name |
|---|---|---|
| 0x0BD3 | f32 (Multiplied by 1) | Voltage L1 (Volts) |
| 0x0BD5 | f32 (Multiplied by 1) | Voltage L2 (Volts) |
| 0x0BD7 | f32 (Multiplied by 1) | Voltage L3 (Volts) |
| 0x0BB7 | f32 (Multiplied by 1) | Current L1 (Amps) |
| 0x0BB9 | f32 (Multiplied by 1) | Current L2 (Amps) |
| 0x0BBB | f32 (Multiplied by 1) | Current L3 (Amps) |
| 0x0BED | f32 (Multiplied by 1000) | Active Power L1 (Watts) |
| 0x0BEF | f32 (Multiplied by 1000) | Active Power L2 (Watts) |
| 0x0BF1 | f32 (Multiplied by 1000) | Active Power L3 (Watts) |
| 0x0BFB | f32 (Multiplied by 1000) | Reactive Power Total (VAR) |
| 0x0C03 | f32 (Multiplied by 1000) | Apparent Power Total (VA) |
| 0x0DBD | u64 (Multiplied by 1) | Active Energy Import L1 (Wh) |
| 0x0DC1 | u64 (Multiplied by 1) | Active Energy Import L2 (Wh) |
| 0x0DC5 | u64 (Multiplied by 1) | Active Energy Import L3 (Wh) |
| 0x0C83 | u64 (Multiplied by 1) | Active Energy Import Total (Wh) |
| 0x0C87 | u64 (Multiplied by 1) | Active Energy Export Total (Wh) |
| 0x0C93 | u64 (Multiplied by 1) | Reactive Energy Import Total (VARh) |
| 0x0C97 | u64 (Multiplied by 1) | Reactive Energy Export Total (VARh) |
| 0x1063 | u64 (Multiplied by 1) | Active Energy Import Total T1 (Wh) |
| 0x1067 | u64 (Multiplied by 1) | Active Energy Import Total T2 (Wh) |
Types used in tables:
u32- unsigned 32-bit integers32- signed 32-bit integeru64- unsigned 64-bit integerf32- 32-bit floating point number
Active and reactive energy registers are used to calculate billing data. Active power peaks are calculated via active energy. The other registers are measured for monitoring and diagnostic purposes.
Environment
OZDS is an ASP.NET Core web application hosted on Azure App Service. The application connects to a Postgresql database with TimescaleDB extension. The application listens for incoming data from Raspberry Pi 4B devices via HTTP POST requests. Users access the application via a web browser. The application is rendered via Blazor SSR.
Development
Tools used to develop OZDS are:
Code for the server is hosted on github. The code is developed in vscode.
Code for the Raspberry Pi 4B messengers is also hosted on github. Code for these devices is usually developed by connecting to them via SSH. Messengers are running on a linux distribution called NixOS. The reasoning behind this is that NixOS makes it is easy to reproduce the same environment on all devices.
Deployment
Deployment is done via github actions. The deployment workflow is defined in
.github/workflows/deploy.yml. The workflow is triggered on push to the main
branch. The workflow builds the OZDS web application and uploads it to an Azure
App Service.

Architecture
The architecture of OZDS is a distributed system with multiple locations. The system consists of a server running the ASP.NET Core application, a PostgreSQL database, and multiple locations with meters. The meters are connected to the server via a Raspberry Pi acting as a messenger. The server receives data from the meters and stores it in the database. The server also serves the web application to clients.
The server hosts the ASP.NET Core application, which is divided into three main parts:
- Ozds.Data: Data access layer
- Ozds.Client: Client application
- Ozds.Business: Business logic
Here is the full deployment graph for OZDS:

IOT
Pidgeon
Pidgeon is a Raspberry Pi-based application designed to fetch and manage electrical billing data from various sites. It's a crucial component in an electrical distribution network, facilitating the collection and transmission of meter data.
Key Features
- Meter Discovery: Pidgeon automatically discovers meters it recognizes on the site's network.
- Health Checks: Regular pings and health checks ensure the meters and Pidgeon itself are functioning correctly.
- Data Collection: Workers are started to take electrical measurements at a high frequency to ensure accurate and up-to-date data.
- Local Storage: Measurements are stored in a locally installed PostgreSQL database, serving as an outbox before the data is sent to the server.
- Server Communication: Pidgeon sends the measurements to the server and polls the server for any edited configuration.
- Tariff Setting: Pidgeon is also responsible for setting the daily and nightly tariffs of the meters.
By optimizing for the frequency of measurement, Pidgeon ensures the most accurate and current data is always available. This data is crucial for generating accurate billing information and providing valuable data for research and analysis.
Architecture
The architecture of Pidgeon is designed to efficiently collect and manage electrical billing data. The diagram below provides a visual representation of the system's architecture.
In the context of a location, there are various types of meters, such as the Abb B2x meter and the Schneider iEM3xxx meter, which are connected via RS-485. The Gateway, accessible via port 502, serves as an intermediary for data communication.
The Raspberry Pi hosts the Pidgeon application, which is divided into three main packages: Configuration, Services, and Processes.
- Configuration: This package contains the Manager component, responsible for managing the application's configuration.
- Services: This package contains several service components:
- Hardware: Interacts with the physical hardware of the Raspberry Pi.
- Network: Manages network communications.
- Modbus: Handles the Modbus protocol for communication with the meters.
- Database: Manages the local PostgreSQL database.
- Cloud: Handles communication with the cloud server.
- Processes: This package contains various processes that Pidgeon runs:
- Discovery: Discovers meters on the network.
- Ping: Regularly checks the health of the meters.
- Measure: Takes electrical measurements from the meters.
- Health: Checks the health of Pidgeon and stores it in the local database.
- Push: Sends measurements to the cloud server.
- Poll: Polls the cloud server for configuration updates.
- Update: Updates the server of meter and Raspberry PI health.
- Daily: Sets the daily tariff of the meters.
- Nightly: Sets the nightly tariff of the meters.
Please refer to the diagram for a visual representation of these components and their interactions.

Environment
This document outlines the development environment requirements for this
project. These requirements are necessary to execute the commands defined in the
justfile.
Requirements
- Rust: The project uses Rust, and the
cargocommand is used for building, testing, and running the Rust code. It's also used for generating documentation and formatting the Rust code. - Docker: Docker is used to manage services that the application depends on.
The
docker compose up -dcommand is used to start these services, anddocker compose down -vis used to stop them.
Optional Requirements
The following tools are optional for some workflows but recommended for development:
Probe
- Python: Python is used for the
probescript. You need to have Python installed to run this script. - Poetry: Poetry is used for managing Python dependencies.
Formatting
- Yapf: Yapf is used for formatting Python code in the project.
- Prettier: Prettier is used for formatting and checking the format of the code in the project.
- shfmt: shfmt is used for formatting shell scripts in the project.
Linting
- ShellCheck: ShellCheck is used for linting shell scripts.
- cspell: cspell is used for spell checking in the project.
- Ruff: Ruff is used for checking Rust code in the project.
- Clippy: Clippy is a Rust linter that's used in the project.
- Pyright: Pyright is used for type checking Python code.
Documentation
- mdbook: mdbook is used for building the documentation.
Development Workflow
The development workflow is managed by just, a command runner that's similar
to make. The justfile at the root of the repository defines various commands
for building, testing, running, and managing the project.
Here are the steps to set up the development environment and use just:
-
Install Dependencies: Install all the required tools listed in this chapter.
-
Prepare the Environment: Run
just prepareto install Python dependencies, start Docker services, and run database migrations. -
Run the Application: Use
just runto run the application. You can pass arguments to the application by appending them to the command, likejust run --arg. -
Run the Probe Script: Use
just probeto run the probe script. You can pass arguments to the script in the same way as the run command. -
Format the Code: Use
just formatto format the code in the project using various formatters. -
Lint the Code: Use
just lintto lint the code in the project using various linters. -
Test the Code: Use
just testto run the tests for the project. -
Build the Project: Use
just buildto build the project. This will create a release build of the project and move the output to theartifactsdirectory. -
Generate Documentation: Use
just docsto generate the project's documentation. This will build the documentation and move the output to theartifactsdirectory.
Remember to run just prepare whenever you pull new changes from the
repository, to ensure your environment is up-to-date.
Installation
The installation of Pidgeon involves several steps, each of which is detailed on its own page. Here's an overview of the process:
-
Generate Secrets: A script in the repository uses
sopsandopensslto generate secrets for a specific Raspberry Pi. This step is crucial for securing communication between the device and the server. -
Create ISO Image: Another script in the repository uses
nix buildto create an ISO image for the device. This image contains the Pidgeon application and all its dependencies. -
Inject Secret key: The secret key generated in step 1 is injected into the image using a script in the repository. The secret key is used to decrypt the secrets generated in step 1 during boot.
-
Assemble the Device: The ISO image is flashed onto a 1TB SSD. The SSD is then plugged into a USB port of the Raspberry Pi, and the power USB-C cable is plugged in.
Push
Measurements are pushed to the server by messenger devices via a simple REST
API. The endpoint is on /iot/push/{messengerId} and accepts JSON payloads with
the following schema:
{
  // Time when request was sent
  "timestamp": "<ISO 8601 timestamp>",
  "measurements": [
    {
      // Meter id is a string with the following schema:
      // <manufacturer>-<model>-<serial>
      "meterId": "<meterId>",
      // Time when measurement was taken
      "timestamp": "<ISO 8601 timestamp>",
      "data": {
        // <registers depending on type of device> ...
      }
    }
    // <more measurements> ...
  ]
}
Backend
The OZDS backend is a ASP.NET Core web application. It is divided into packages:
Ozds.Server: startup projectOzds.Data: data access layerOzds.Business: business layerOzds.Client: client UI layer
The business layer is responsible for handling administrative tasks in the web application. The following sections explain the actions needed to perform administrative tasks.
Billing
Billing is the process of issuing invoices to network users and locations. Only network user billing is currently implemented. Currently, operators can issue invoices on demand for the last billing period (last month).
Billing is implemented via a set of classes that calculate different parts of the invoice depending on measurement locations and tariffs.

Frontend
The OZDS frontend is a Blazor SSR (Server-Side Rendering) project based on OrchardCore, which is currently undergoing intensive development.
So far, the basic layout, navigation, user list, device list, detailed device view, and measurement aggregation have been implemented.
Login
On the login page, users start their session. After logging in, the user is redirected to a page personalized to their needs based on their user type, privileges, and the locations and network users they are responsible for.
 /login
Admin
This section describes pages that are accessible only to administrators (usually developers).
Users
On this interface, all aspects of users can be modified, new users can be created, or existing ones can be deleted. These users are later linked to representatives of network users and locations.
 /admin/users
Operator
This section describes pages that are accessible only to operators.
Representatives
Representatives are linked to OrchardCore users and allow us to add more data to users. This data can be viewed and edited on this page.
 /app/representatives
Network user
This section describes pages that are accessible only to network users.
Dashboard
Here the user can see aggregated consumption measurement data for the current month, the previous month, and a graph of consumption over longer periods. Below the aggregated values is a table of measurement locations showing the consumption of individual measurement locations in the current and previous month, and the calculation totals in the previous month.
By clicking on the names of locations, network users, or measurement locations, users are redirected to a detailed overview of these entities. Locations and network users redirect to a review of user data and privileges. Clicking on measurement locations redirects to a detailed overview of individual measurement locations.
 /app/dashboard
Other
This section describes pages that are accessible to all users depending on navigation and privileges. Essentially, pages that are not restricted to a specific role.
Meter
When one of the measurement locations is clicked, detailed data about that measurement location becomes visible. The initial and final readings at that measurement location per month are displayed, along with the total consumption and maximum power during that month. A graph on the right side shows measurements for the last quarter hour, half hour, hour, and six hours, and it can display values for voltage, current, active power, reactive power, and apparent power. A gauge on the left side shows the current power and compares it to the maximum power from the previous month.
 /app/meter