Frontend
The OZDS frontend is a Blazor SSR (Server-Side Rendering) project based on OrchardCore, which is currently undergoing intensive development.
So far, the basic layout, navigation, user list, device list, detailed device view, and measurement aggregation have been implemented.
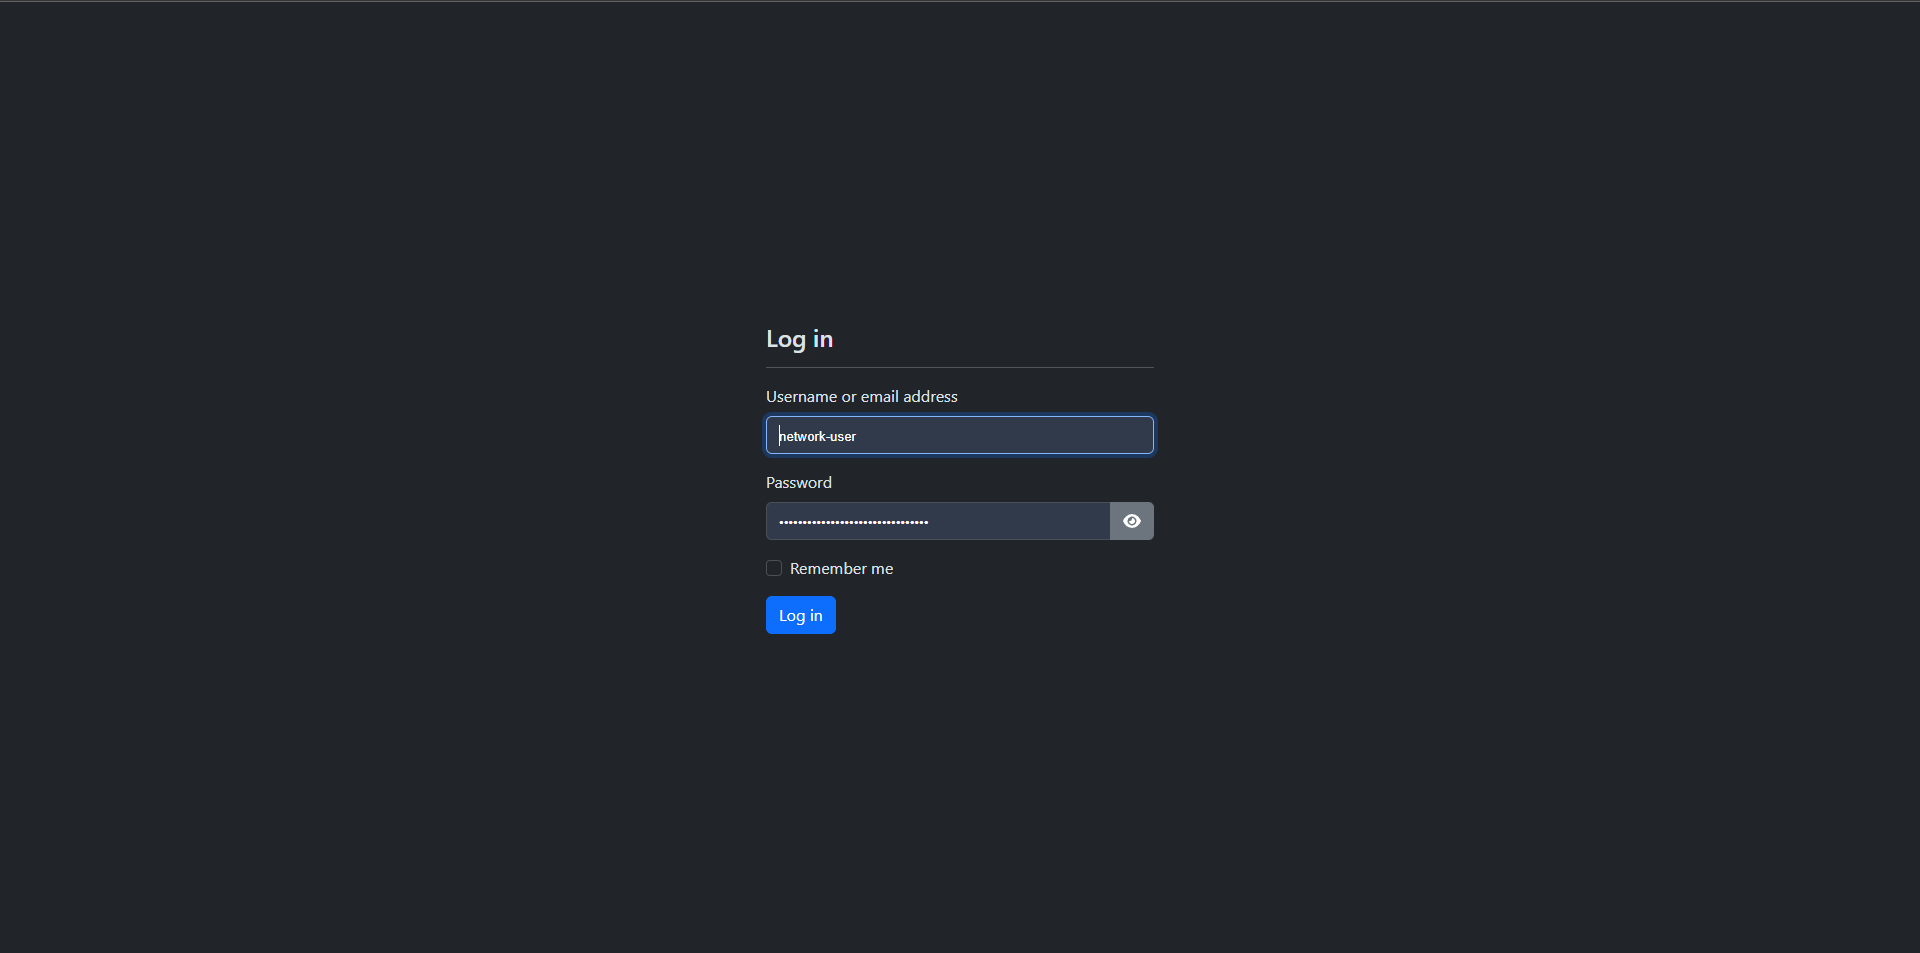
Login
On the login page, users start their session. After logging in, the user is redirected to a page personalized to their needs based on their user type, privileges, and the locations and network users they are responsible for.
 /login
Admin
This section describes pages that are accessible only to administrators (usually developers).
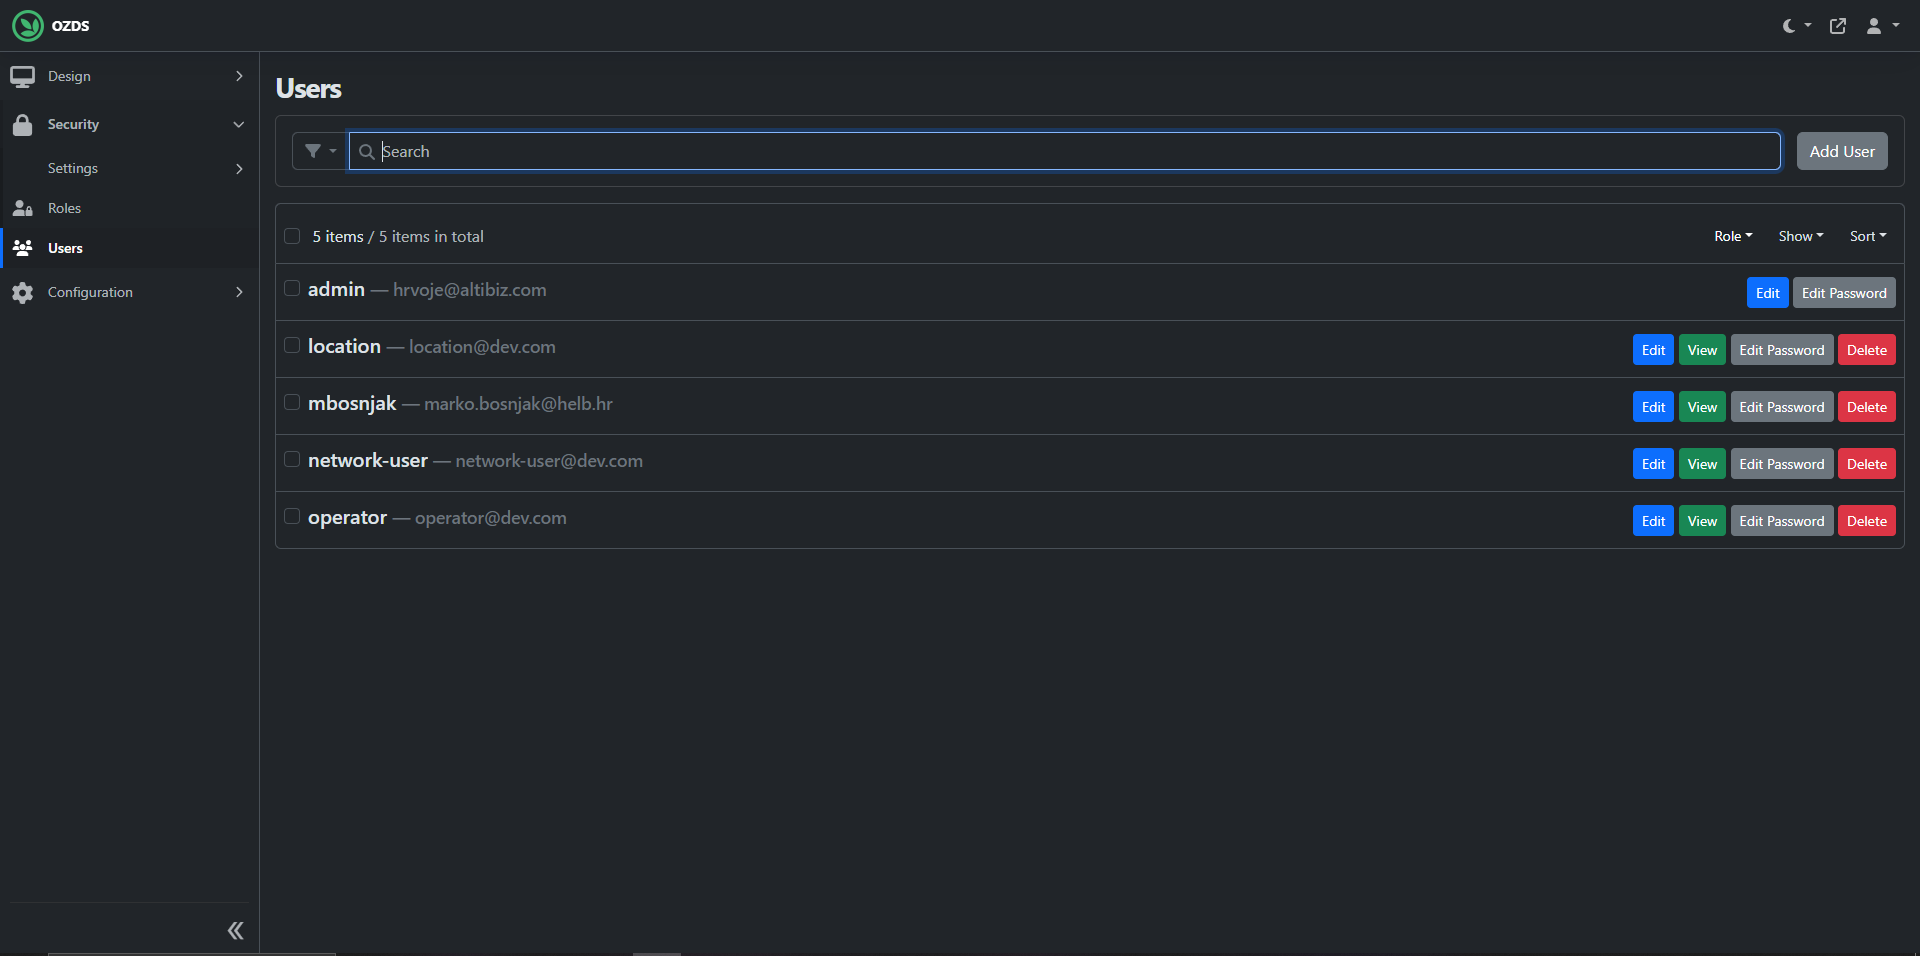
Users
On this interface, all aspects of users can be modified, new users can be created, or existing ones can be deleted. These users are later linked to representatives of network users and locations.
 /admin/users
Operator
This section describes pages that are accessible only to operators.
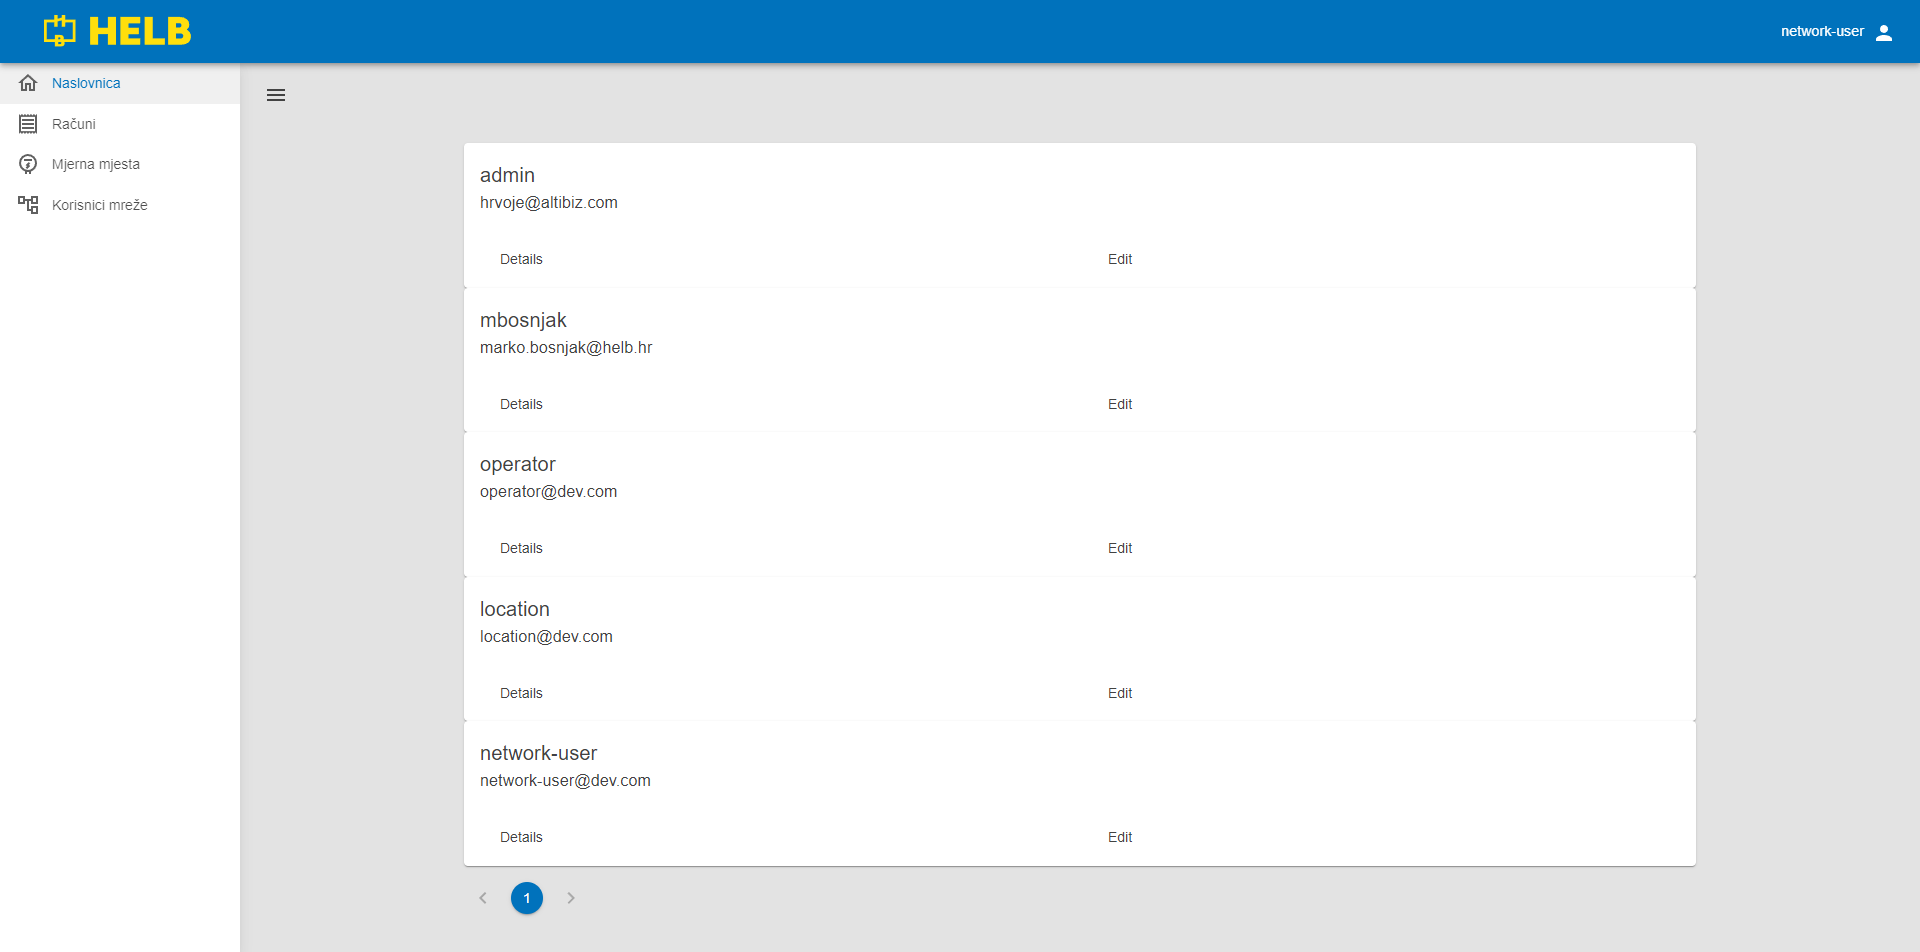
Representatives
Representatives are linked to OrchardCore users and allow us to add more data to users. This data can be viewed and edited on this page.
 /app/representatives
Network user
This section describes pages that are accessible only to network users.
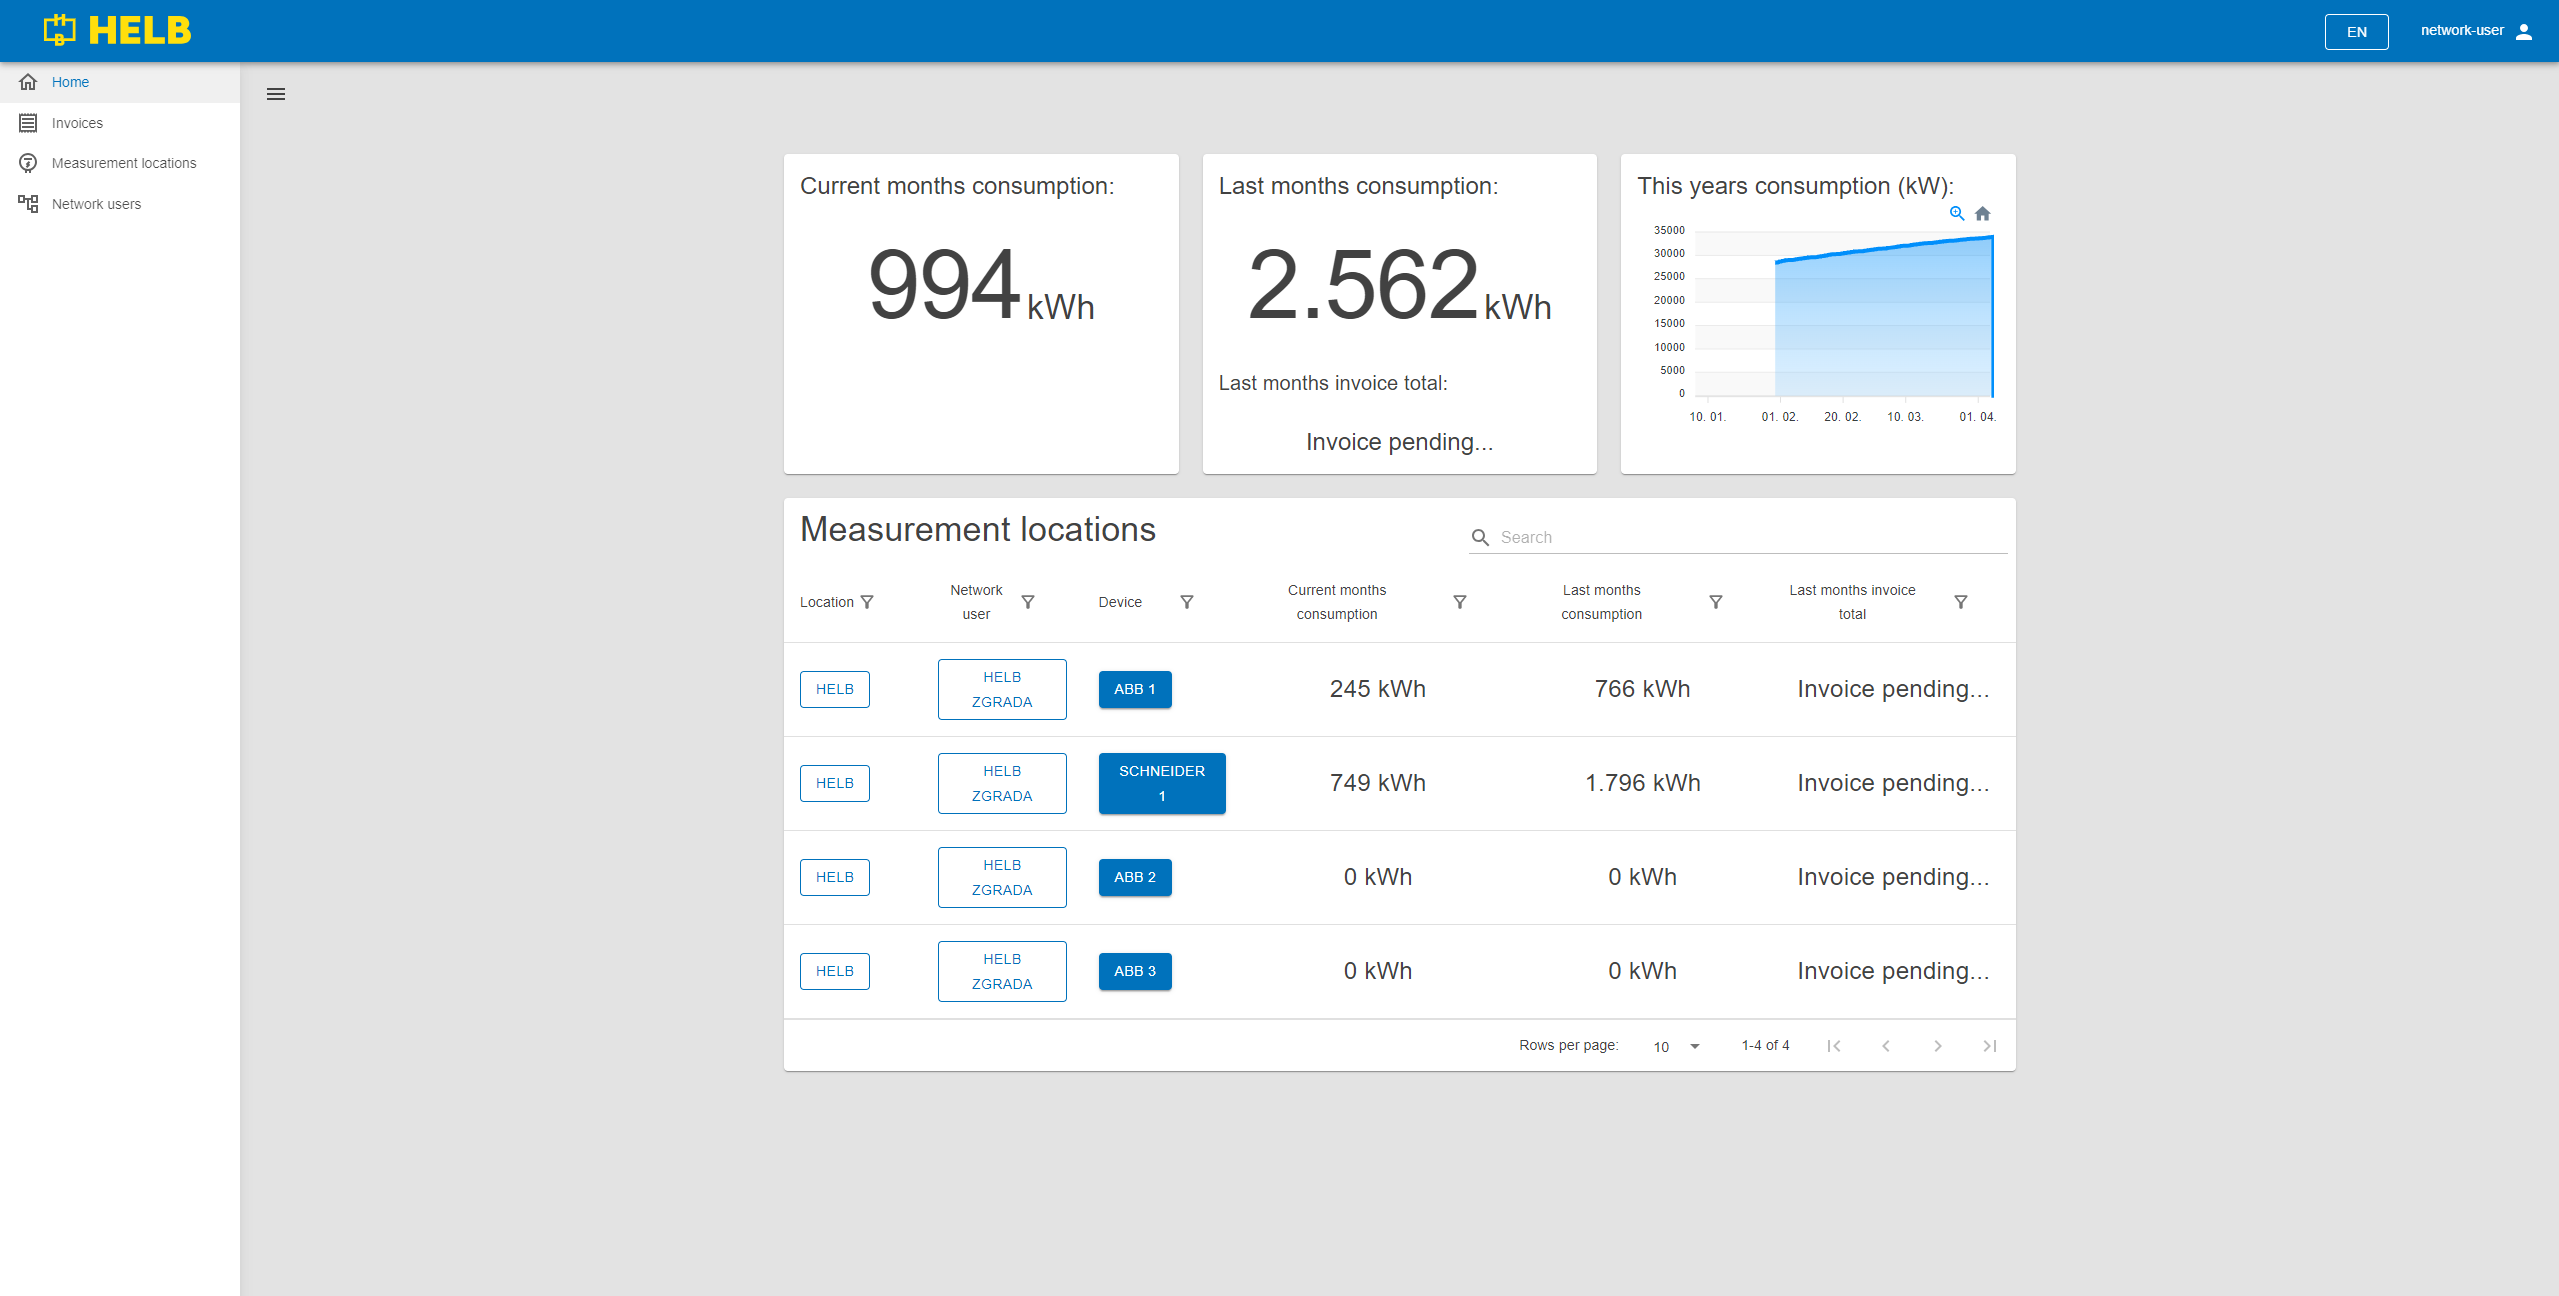
Dashboard
Here the user can see aggregated consumption measurement data for the current month, the previous month, and a graph of consumption over longer periods. Below the aggregated values is a table of measurement locations showing the consumption of individual measurement locations in the current and previous month, and the calculation totals in the previous month.
By clicking on the names of locations, network users, or measurement locations, users are redirected to a detailed overview of these entities. Locations and network users redirect to a review of user data and privileges. Clicking on measurement locations redirects to a detailed overview of individual measurement locations.
 /app/dashboard
Other
This section describes pages that are accessible to all users depending on navigation and privileges. Essentially, pages that are not restricted to a specific role.
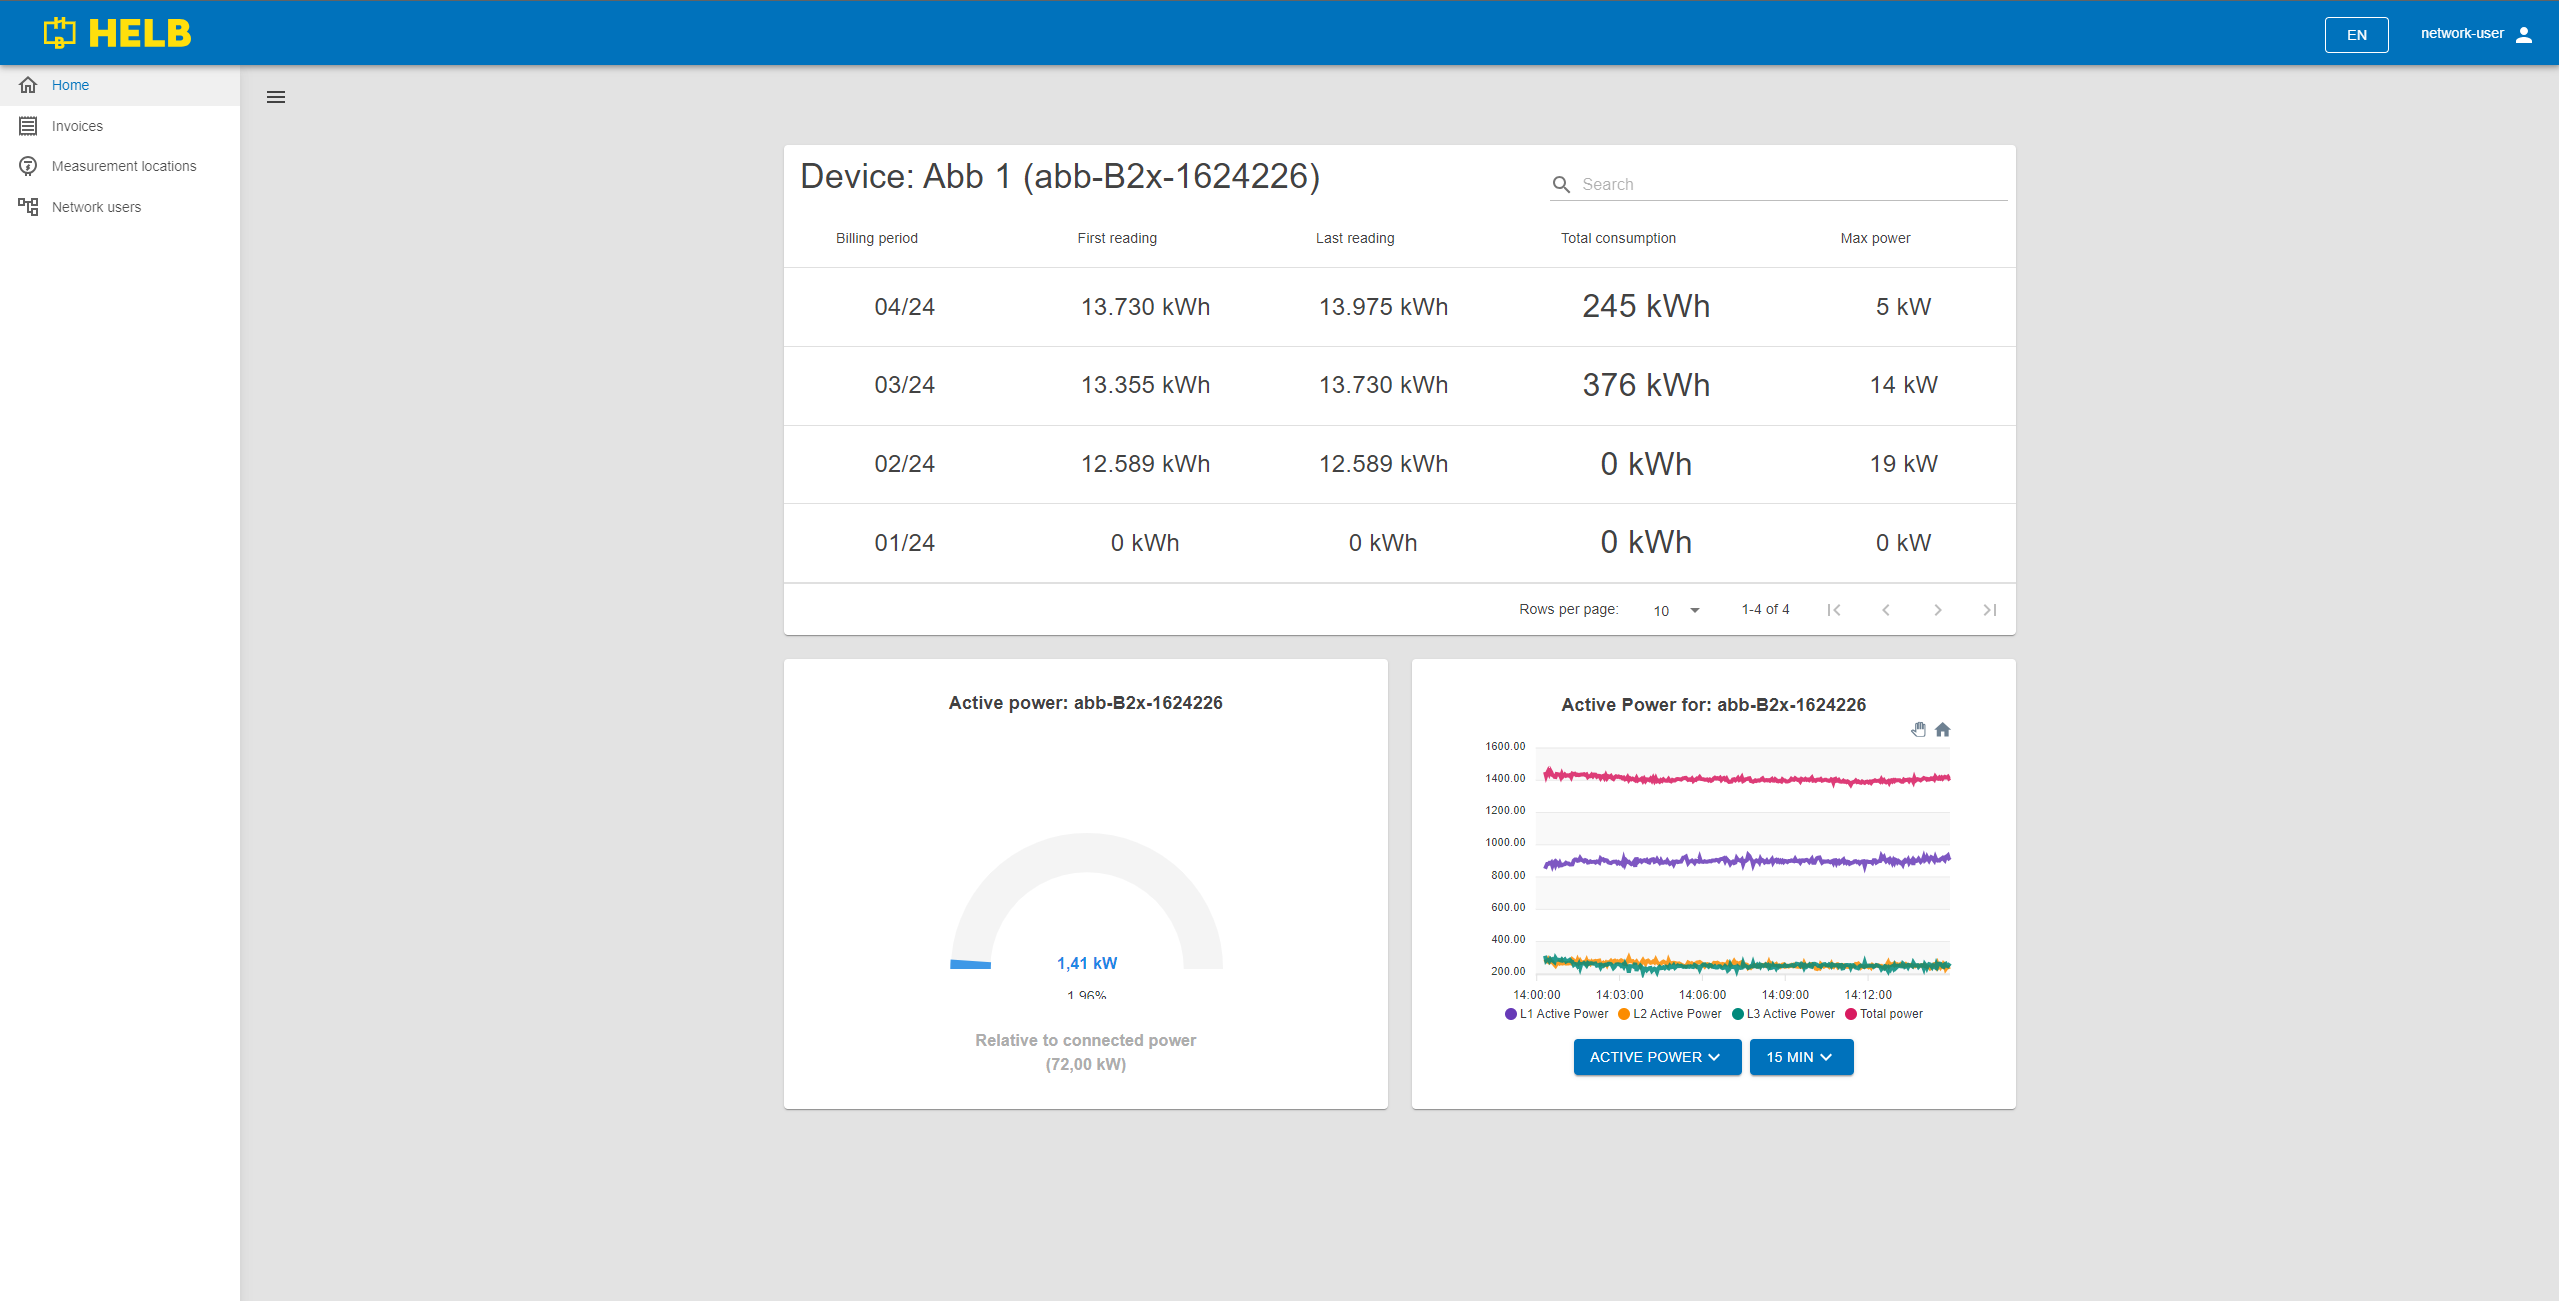
Meter
When one of the measurement locations is clicked, detailed data about that measurement location becomes visible. The initial and final readings at that measurement location per month are displayed, along with the total consumption and maximum power during that month. A graph on the right side shows measurements for the last quarter hour, half hour, hour, and six hours, and it can display values for voltage, current, active power, reactive power, and apparent power. A gauge on the left side shows the current power and compares it to the maximum power from the previous month.
 /app/meter